
Description
vsfplot is a 2D vector and scalar field plotter featuring:
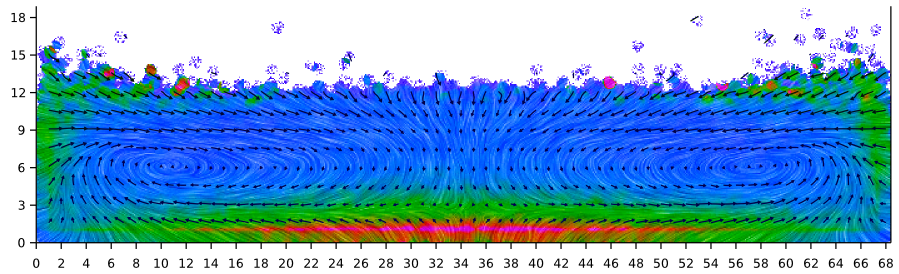
- Line Integral Convolution (LIC) on the data.
- Curvilinear scaled arrows following the flow lines.
- Mixed mode: scalar field map with overlaid vector field.
- Missing data are handled and do not interfere with the flow lines.
- Generation of Scalable Vector Graphics (SVG) files, which are easily editable and convertible while preserving the best quality for inclusion in a PDF scientific article.
- The color palette is designed so the flows are uniformly readable when printed as grey scale.
User Reviews for vsfplot FOR LINUX 1
-
for vsfplot FOR LINUX
vsfplot for Linux is a powerful tool for visualizing vector and scalar fields. Its LIC and SVG generation make it perfect for scientific articles.