
Description
SciGraphica FOR LINUX
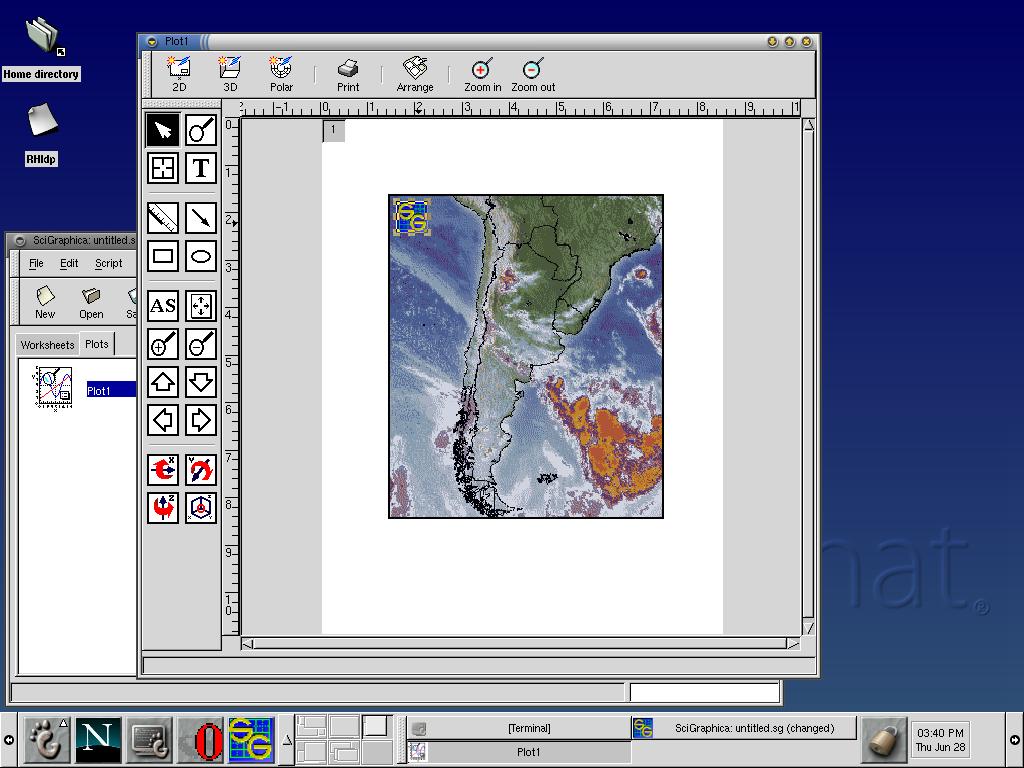
Are you looking for a versatile scientific data visualization and analysis application for your Linux system? Look no further than SciGraphica FOR LINUX. With this free software, you can access many basic plotting features for both 2D and 3D charts, making it a must-have tool for any researcher or scientist.
Key Features:
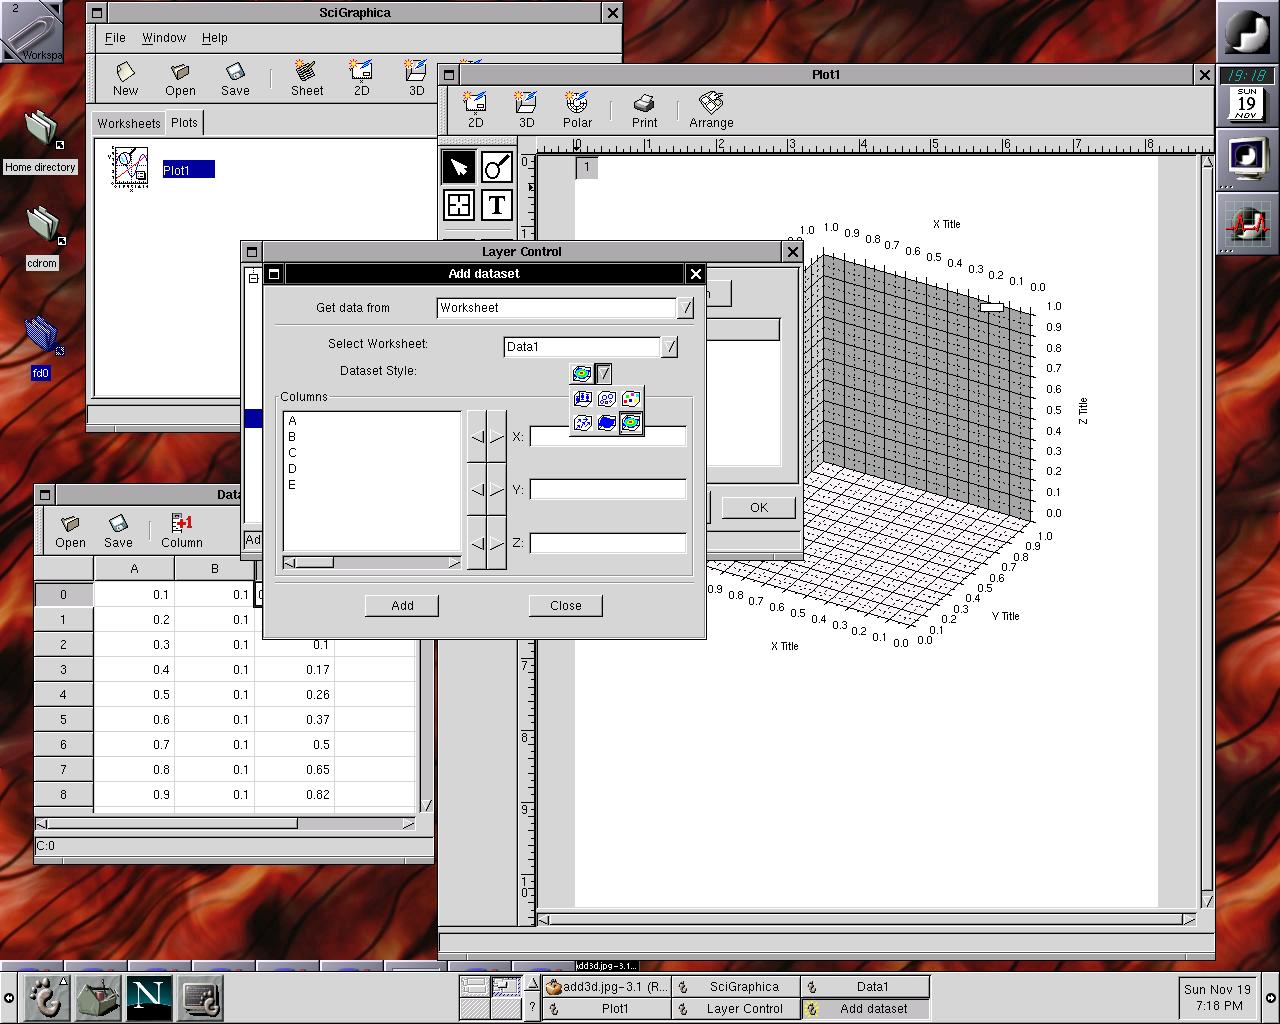
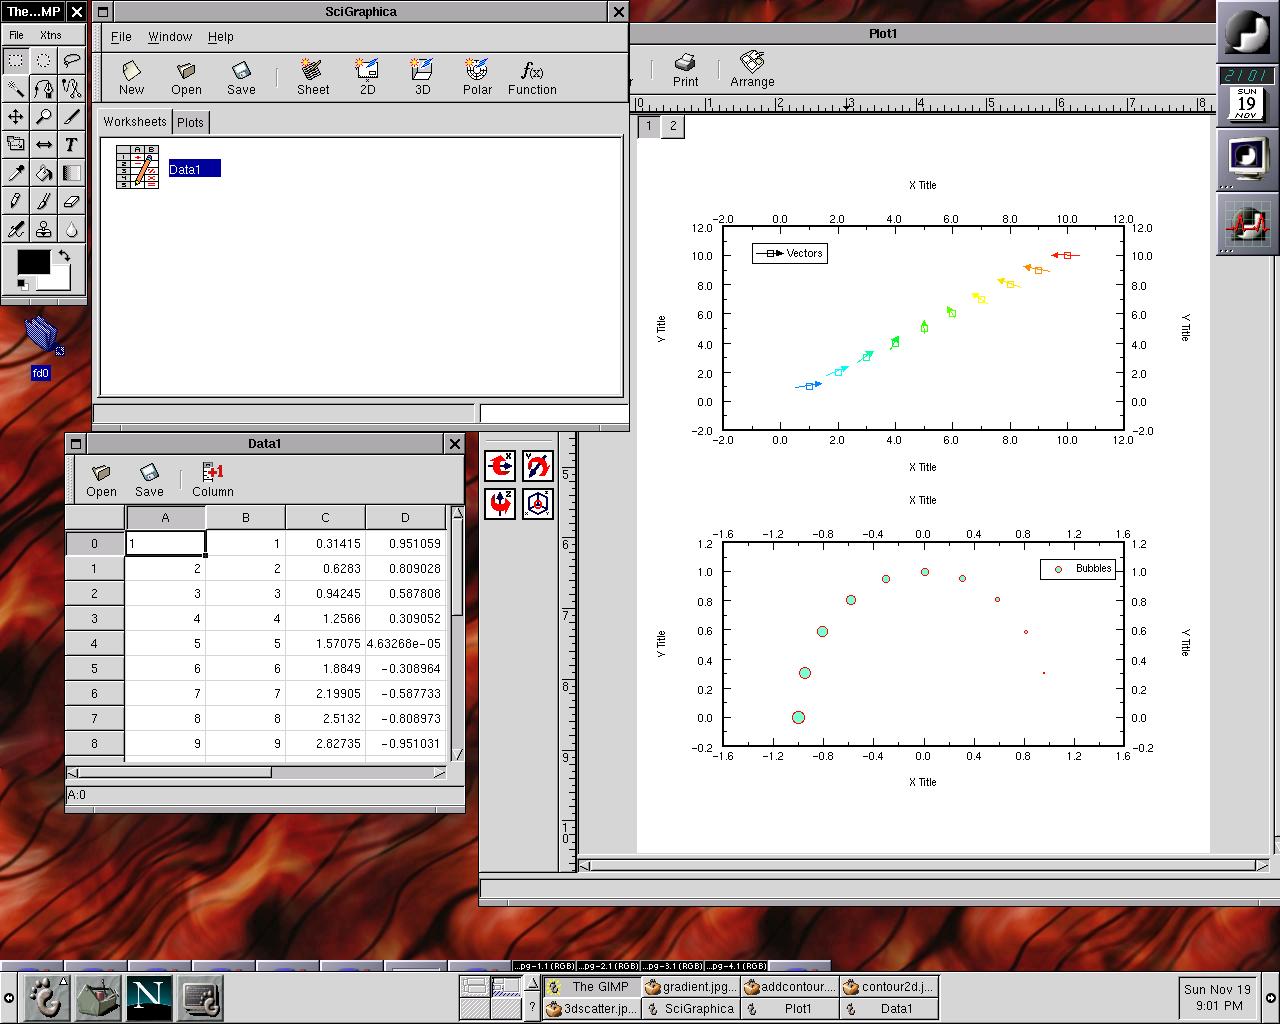
- Plot functions and manipulate data in worksheets
- Open several worksheets and plots to work with interactively at the same time
- Fully configurable using a control panel dialog
- Production quality postscript output
- Interact by double-clicking, dragging, and moving objects with the mouse
- Native XML file format
- Insert Python expressions
- Terminal command-line interface for interacting with worksheets
Technical Specifications:
- Software Name: SciGraphica FOR LINUX
- Price: FREE
- Developer: Adrian E. Feiguin and Conrad Steenberg
- Platform: Linux
- File Format: -
- Output Format: Postscript
Take advantage of SciGraphica's capabilities to enhance your data visualization and analysis processes. The libscigraphica libraries serve as the core of the program, offering a wide range of widgets, dialogs, and a new plugin system to streamline your workflow.
Whether you need to produce publication-quality output or simply want to interact with your data more effectively, SciGraphica FOR LINUX has you covered. Its intuitive interface and powerful features make it a valuable addition to any scientific toolkit.
Download SciGraphica FOR LINUX today and unlock a world of possibilities for your data visualization and analysis needs.
User Reviews for SciGraphica FOR LINUX 7
-
for SciGraphica FOR LINUX
SciGraphica for Linux offers comprehensive plotting features for scientists. Multiple worksheets and WYSIWYG control make data analysis easy.
-
for SciGraphica FOR LINUX
SciGraphica is an incredible tool for scientific visualization! The ability to manipulate data and create stunning 2D and 3D plots is invaluable. Highly recommended!
-
for SciGraphica FOR LINUX
I love using SciGraphica for my research! The WYSIWYG interface makes it easy to visualize complex data, and the PostScript output is perfect for publications.
-
for SciGraphica FOR LINUX
This app has transformed the way I analyze data! Working with multiple worksheets simultaneously is a game changer. Five stars all the way!
-
for SciGraphica FOR LINUX
SciGraphica delivers on all fronts—great features, intuitive design, and powerful plotting capabilities. It's exactly what I needed for my projects!
-
for SciGraphica FOR LINUX
An amazing application! The interactive plotting features are fantastic, and being able to use Python expressions makes it even more versatile. Love it!
-
for SciGraphica FOR LINUX
Absolutely love SciGraphica! The production quality of the plots is top-notch, and it's so easy to use. A must-have for anyone working with scientific data.