

Description
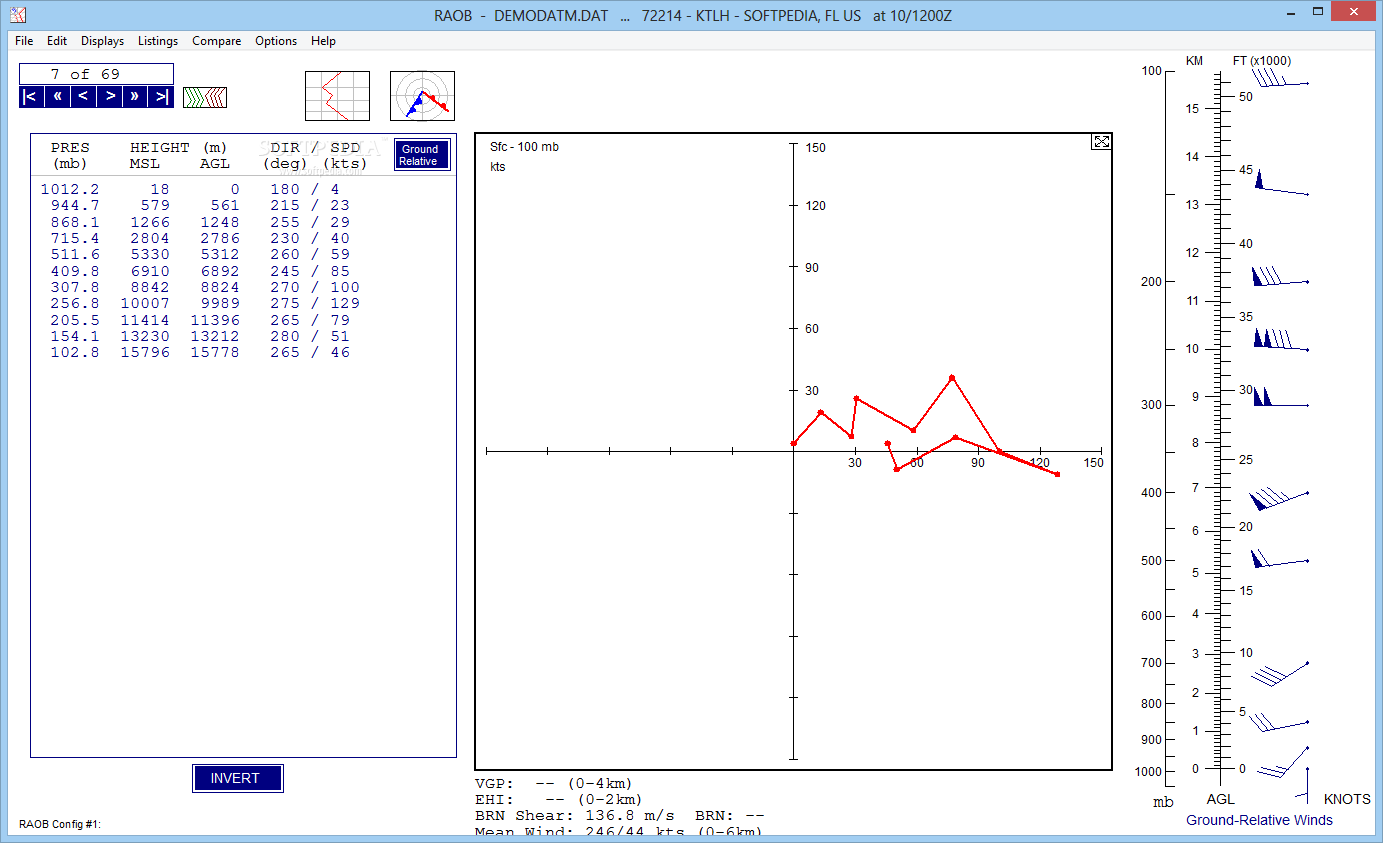
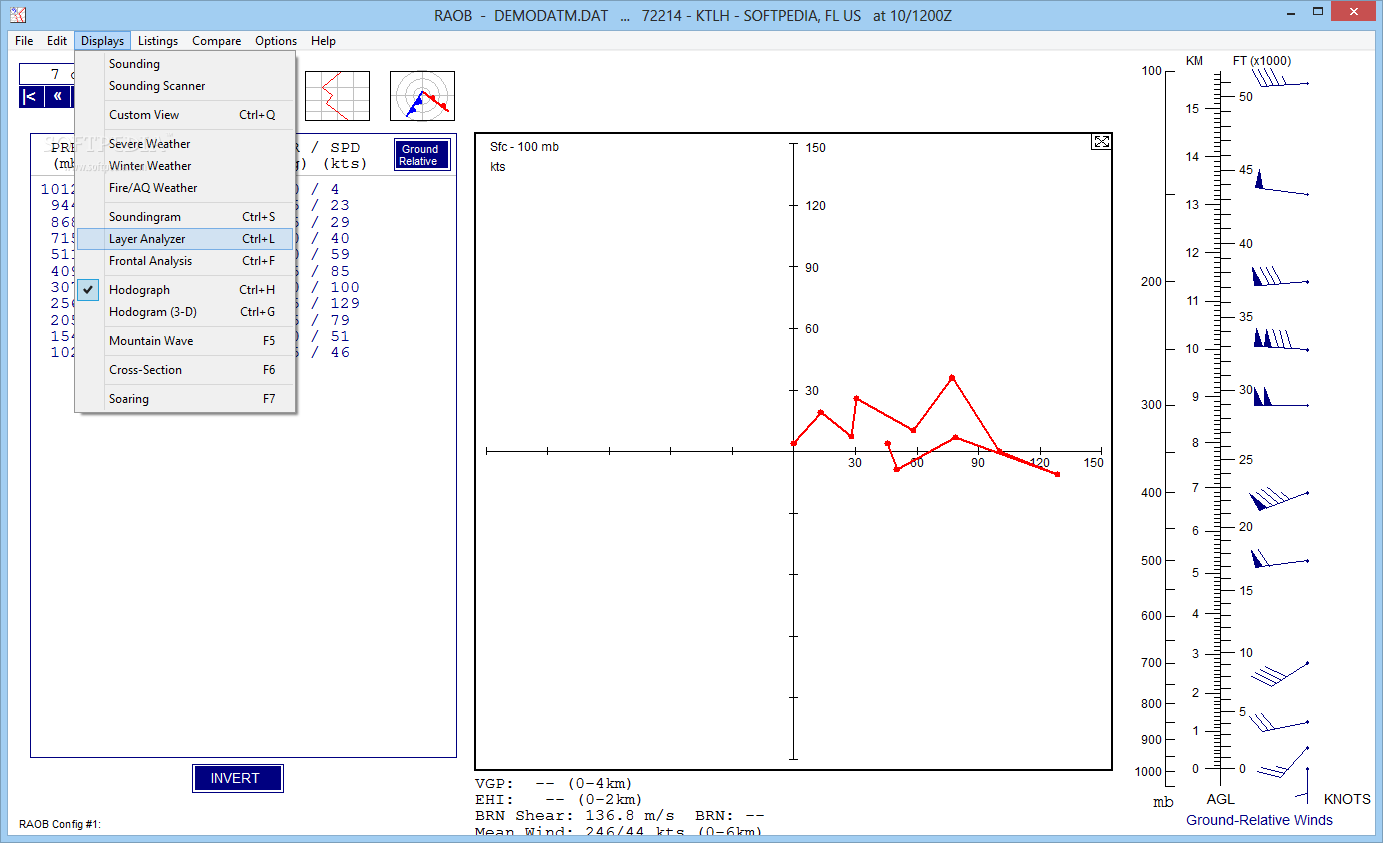
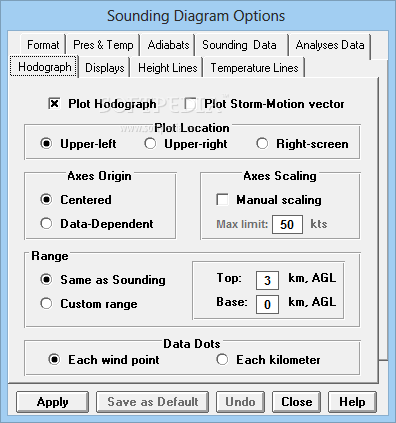
If you need a handy sounding software, then you can give RAOB a try. The application is capable of automatically decode data from over 100 different formats and plots it on twelve interactive displays including skew-Ts, holographs, & cross-sections.
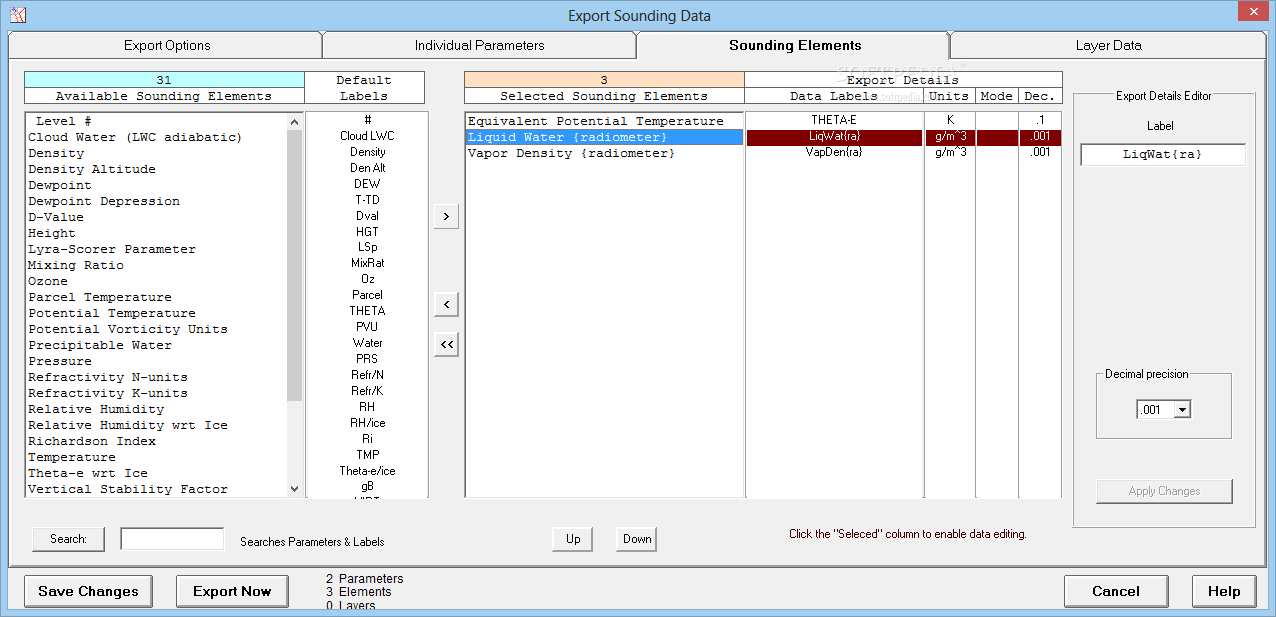
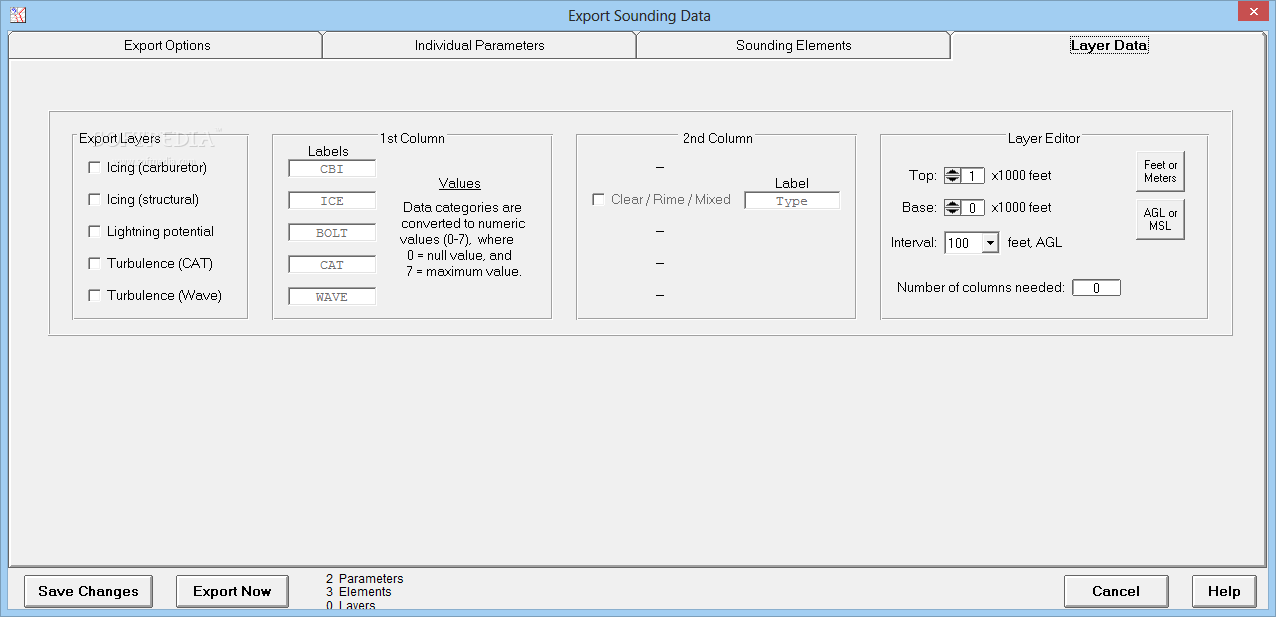
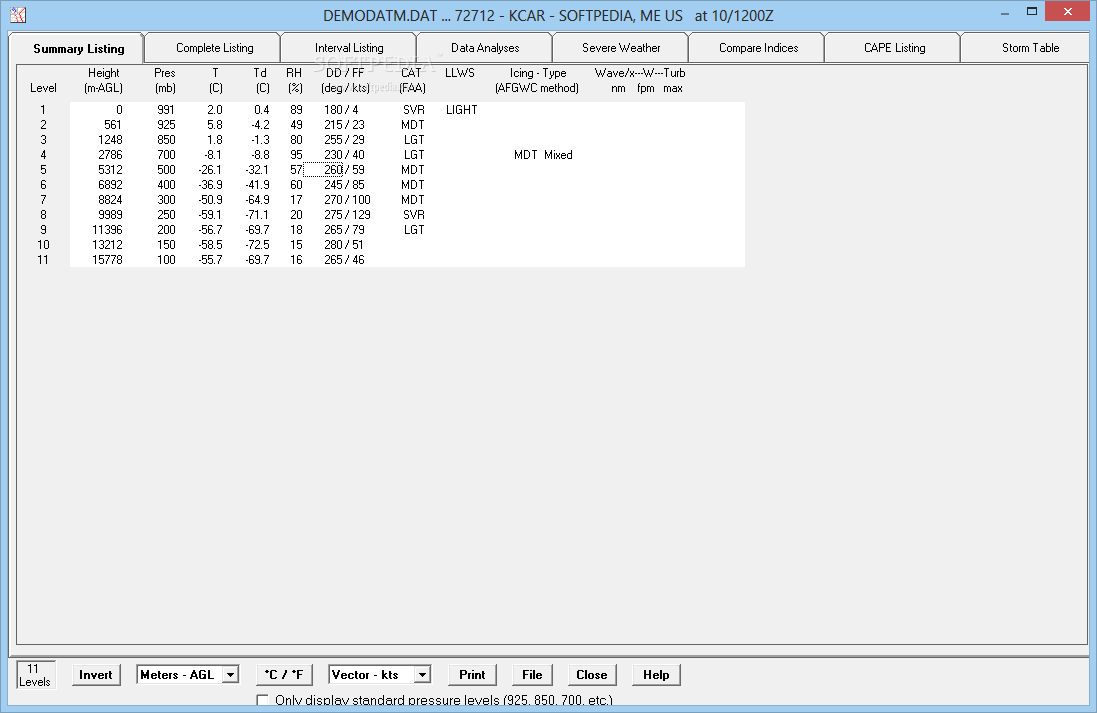
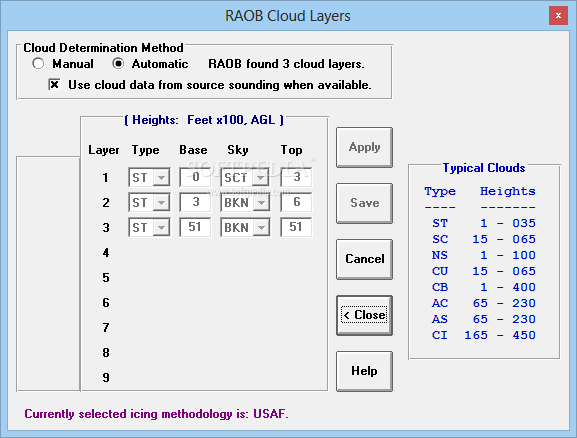
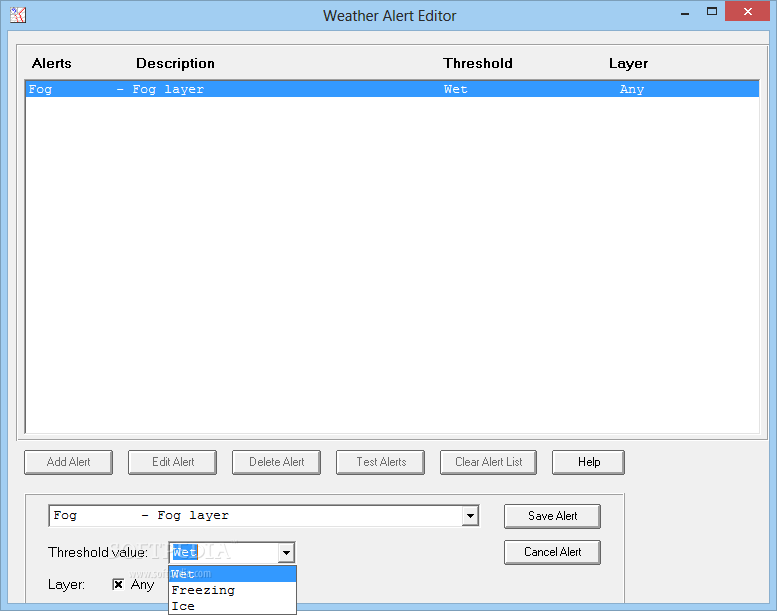
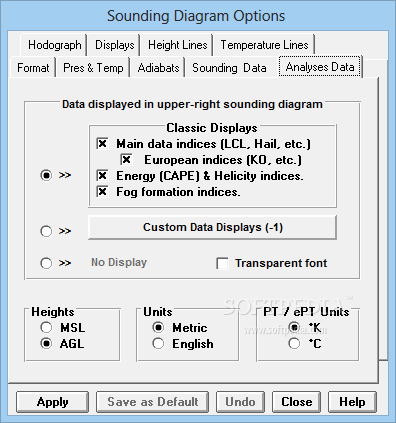
It can also produce and display over two hundred atmospheric parameters including icing, turbulence, wind shear, clouds, inversions and more. The tool is also modular, which means a user can use or take advantage of a single, or several parts of the app with no issues.
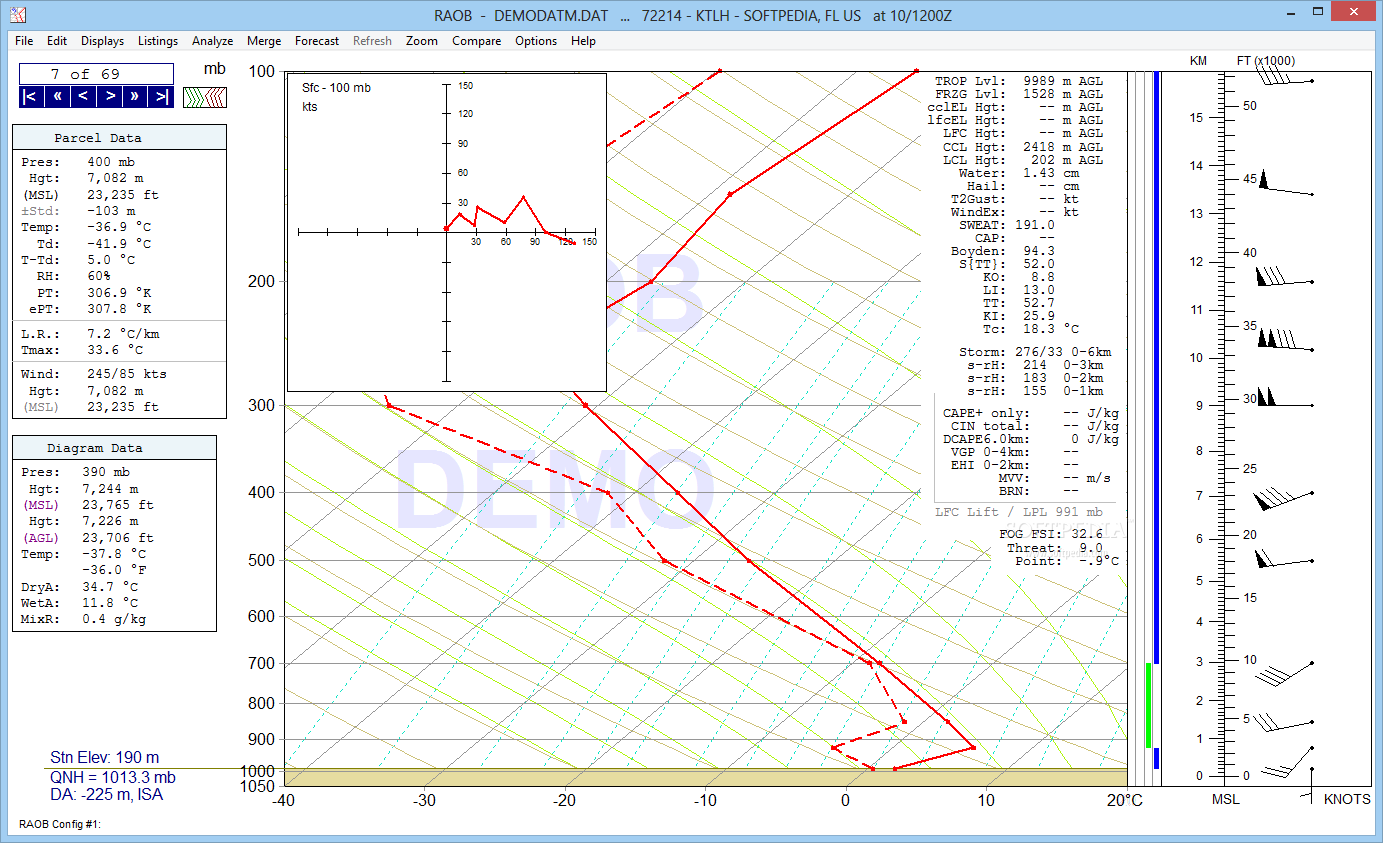
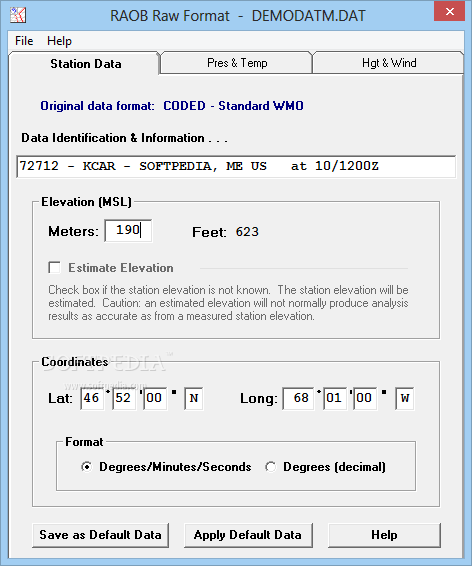
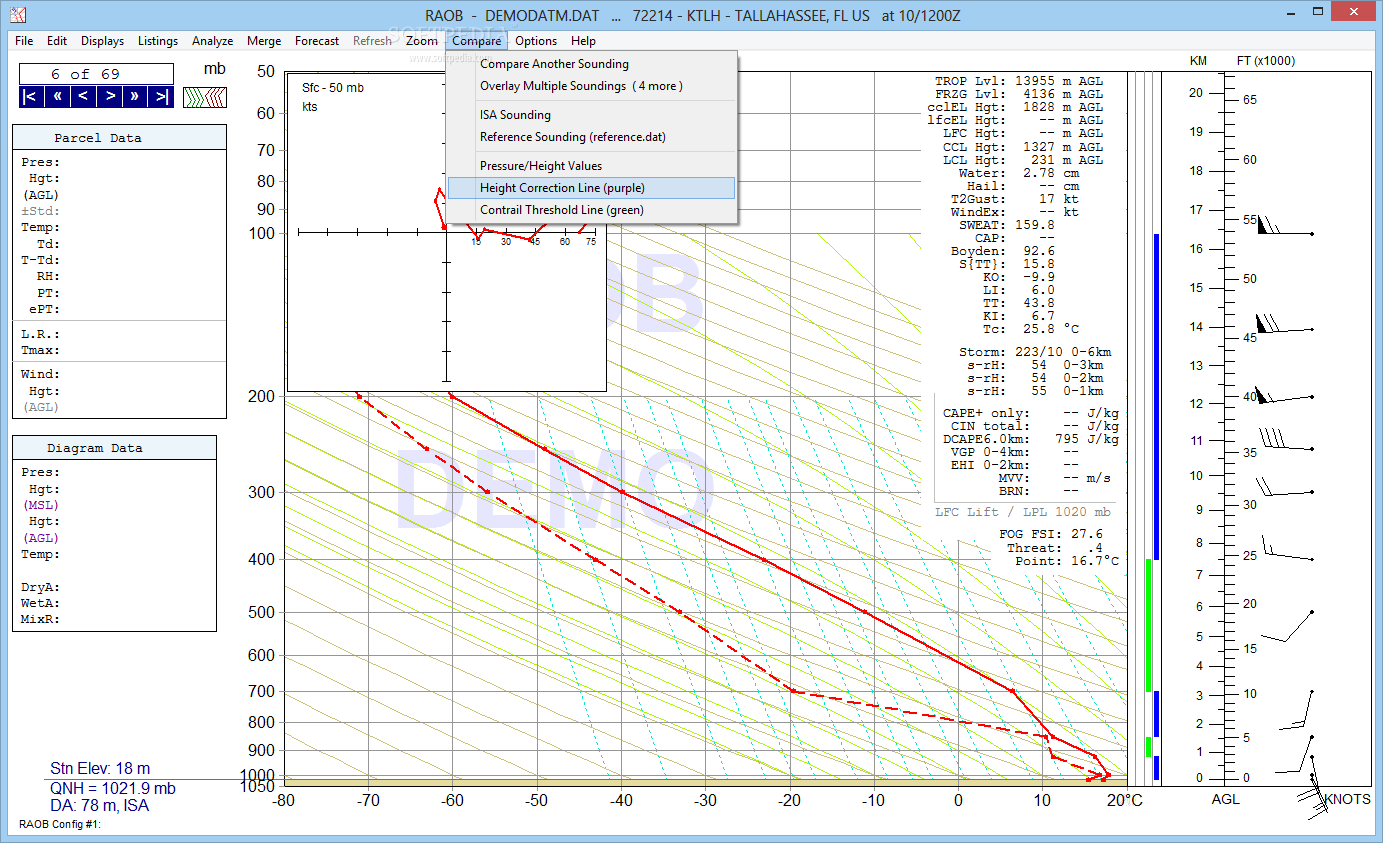
After the brief installation is over, the UI will pop up. At first, for new users, it may look confusing, due to its graph.
The graph is built from coordinates and has no empty or unused space. To test that, hover the mouse on a random area and notice how the "Diagram Data" values are changing.
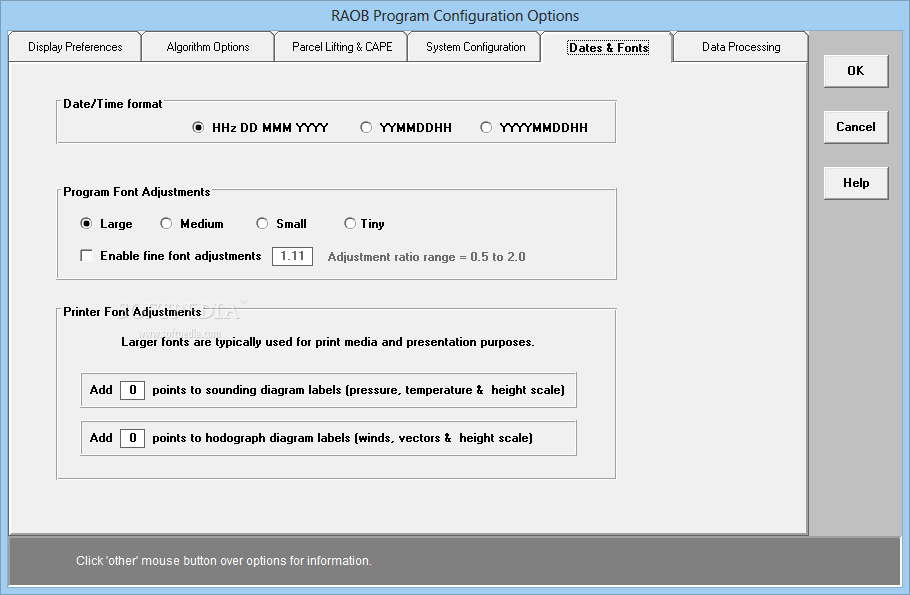
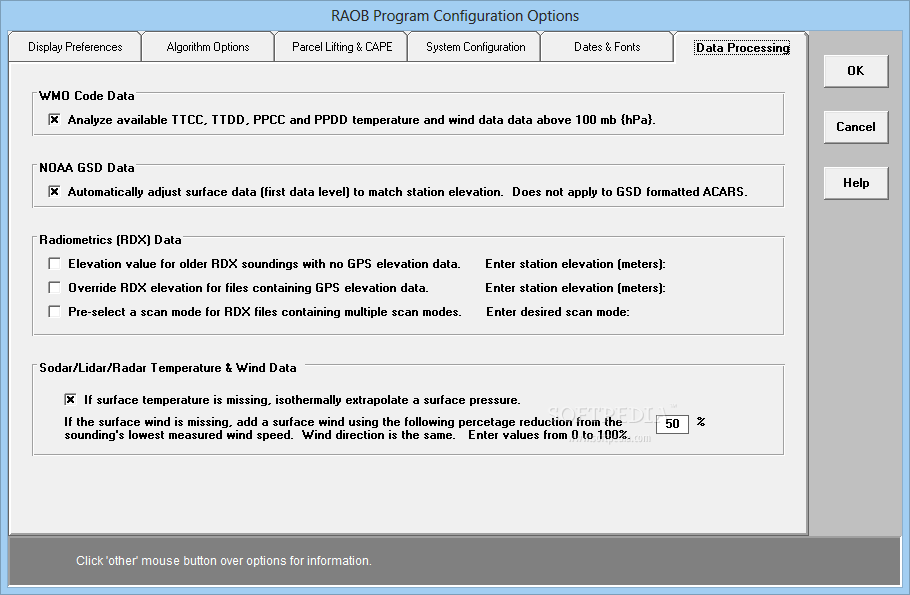
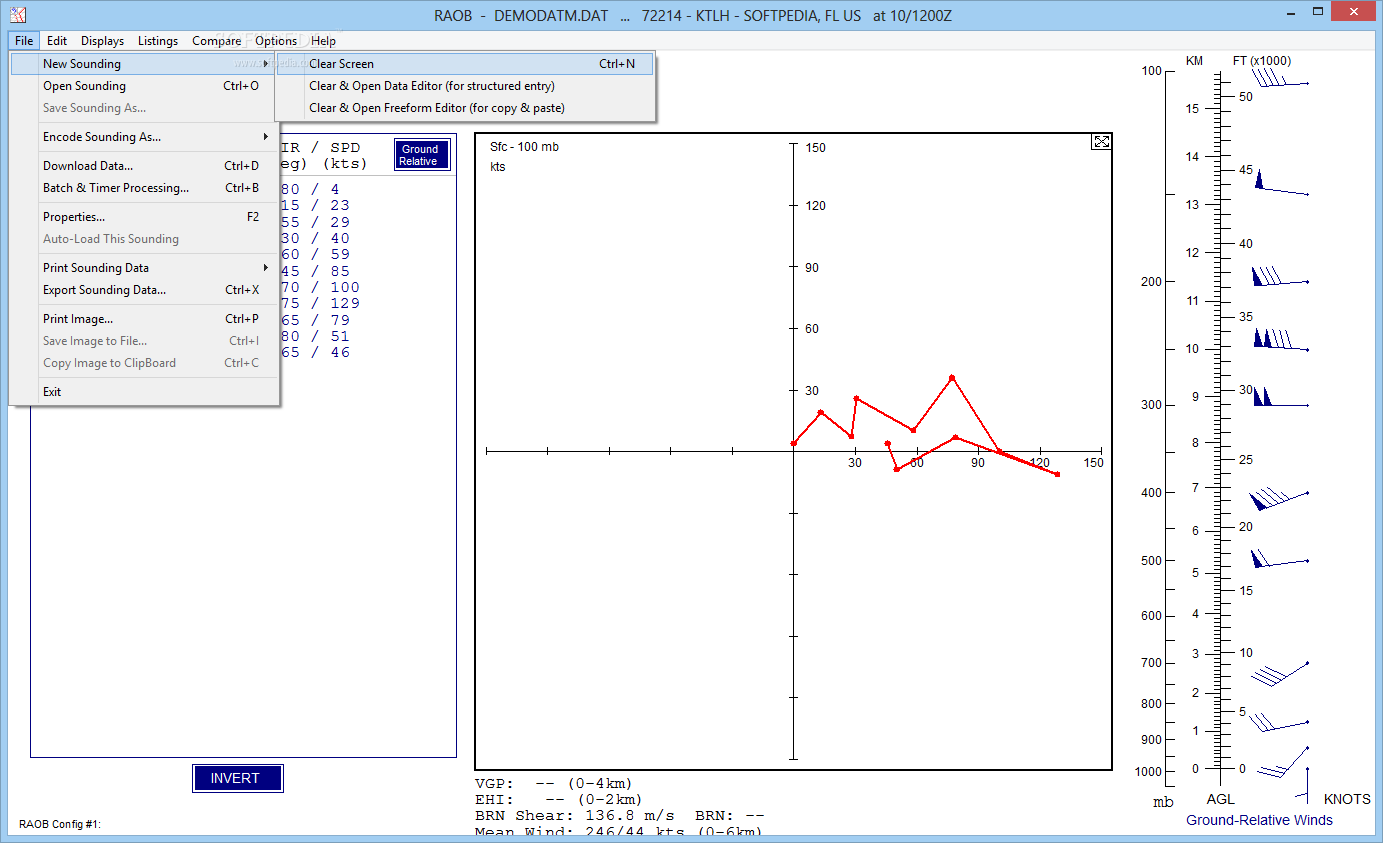
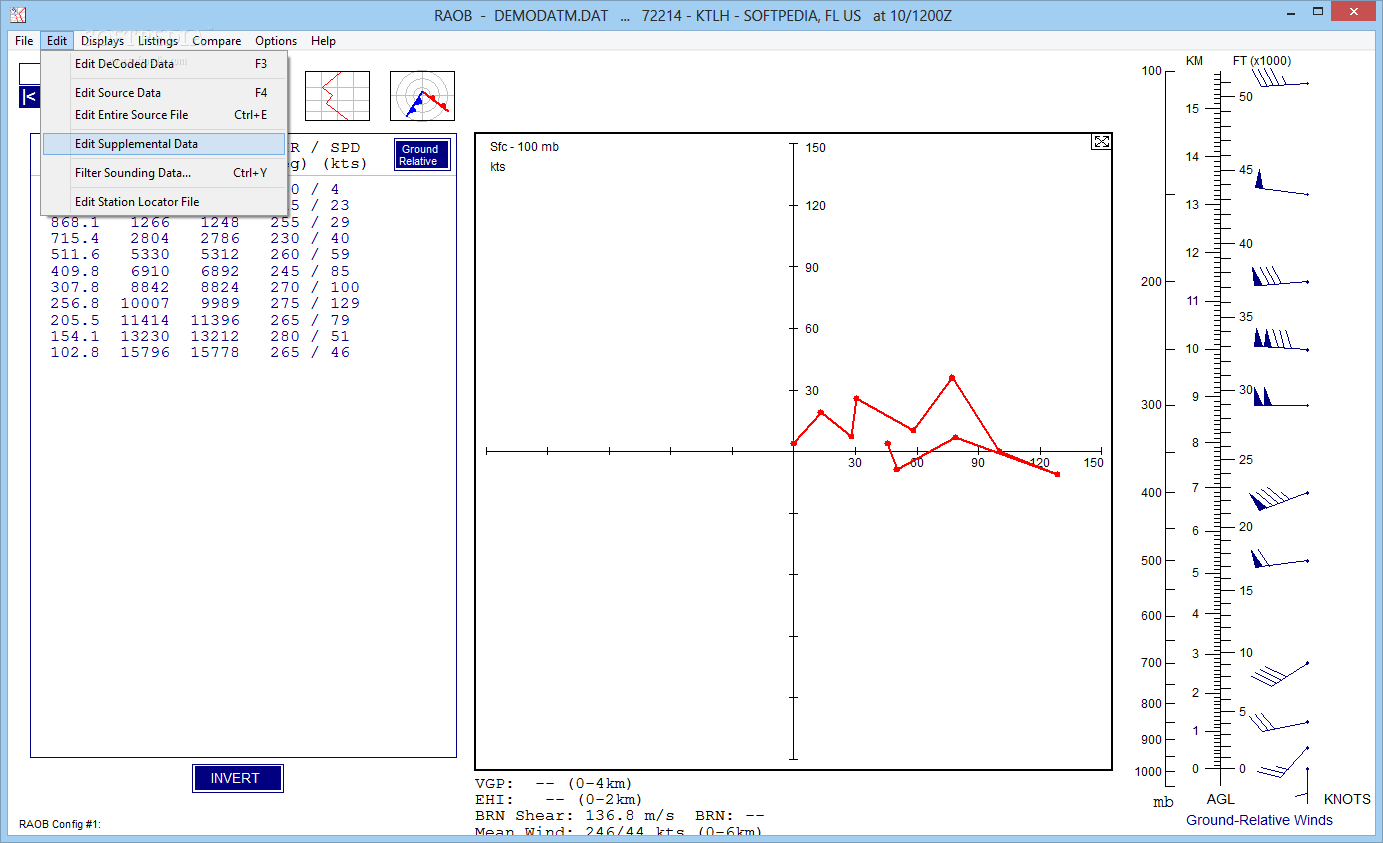
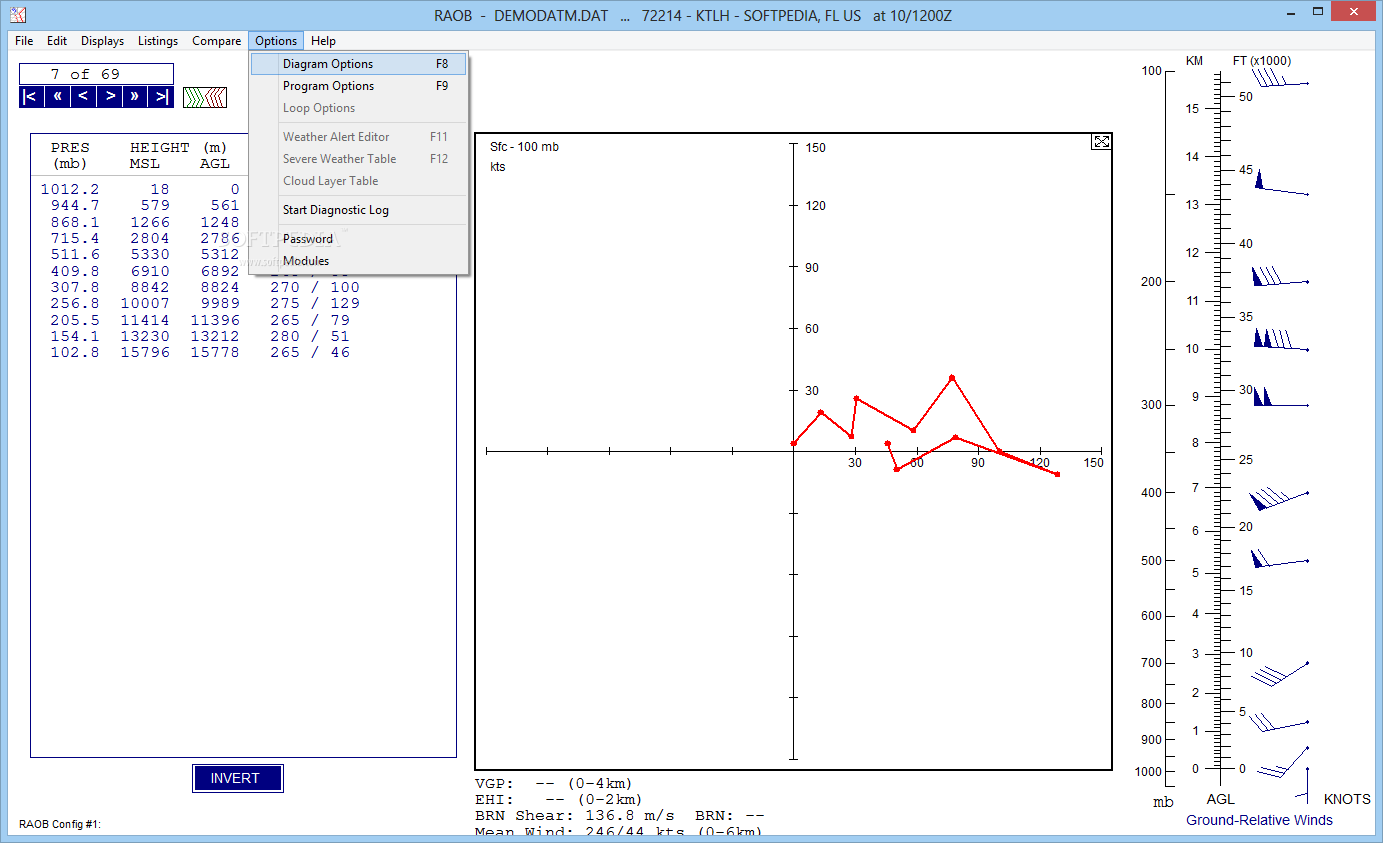
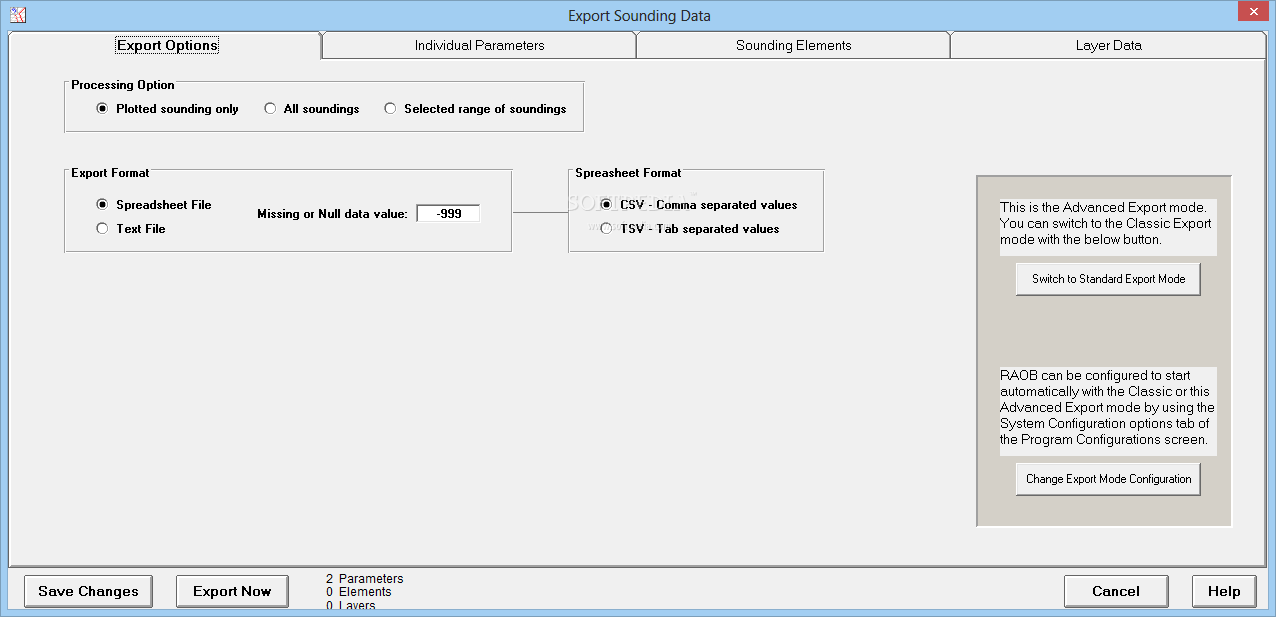
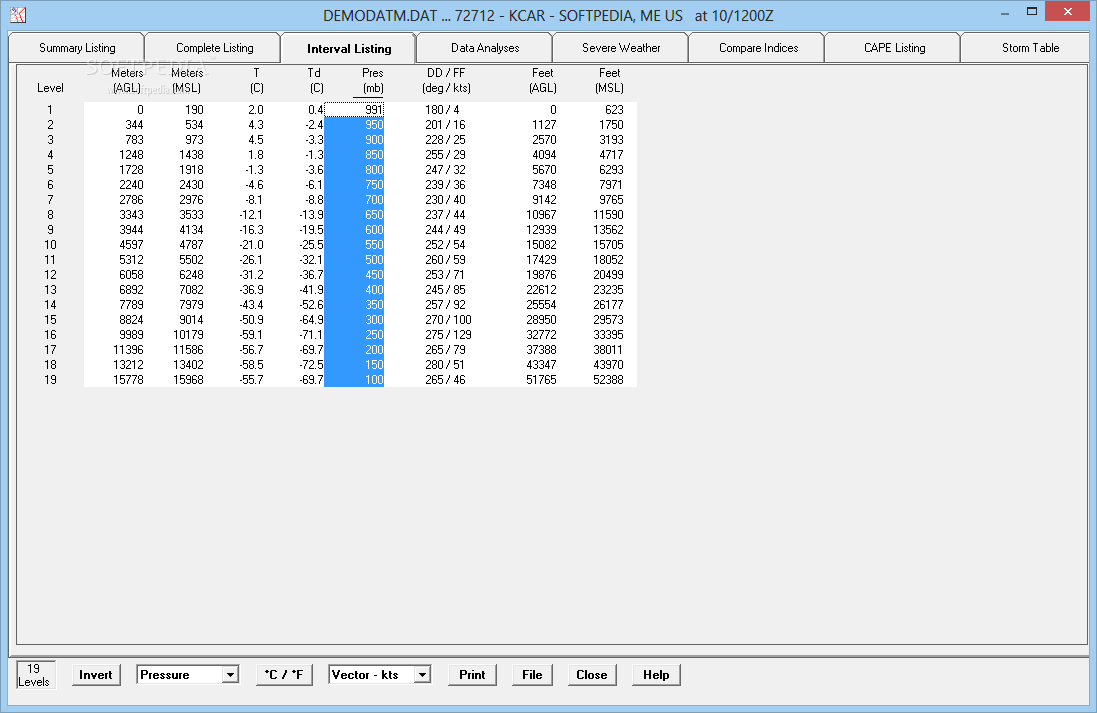
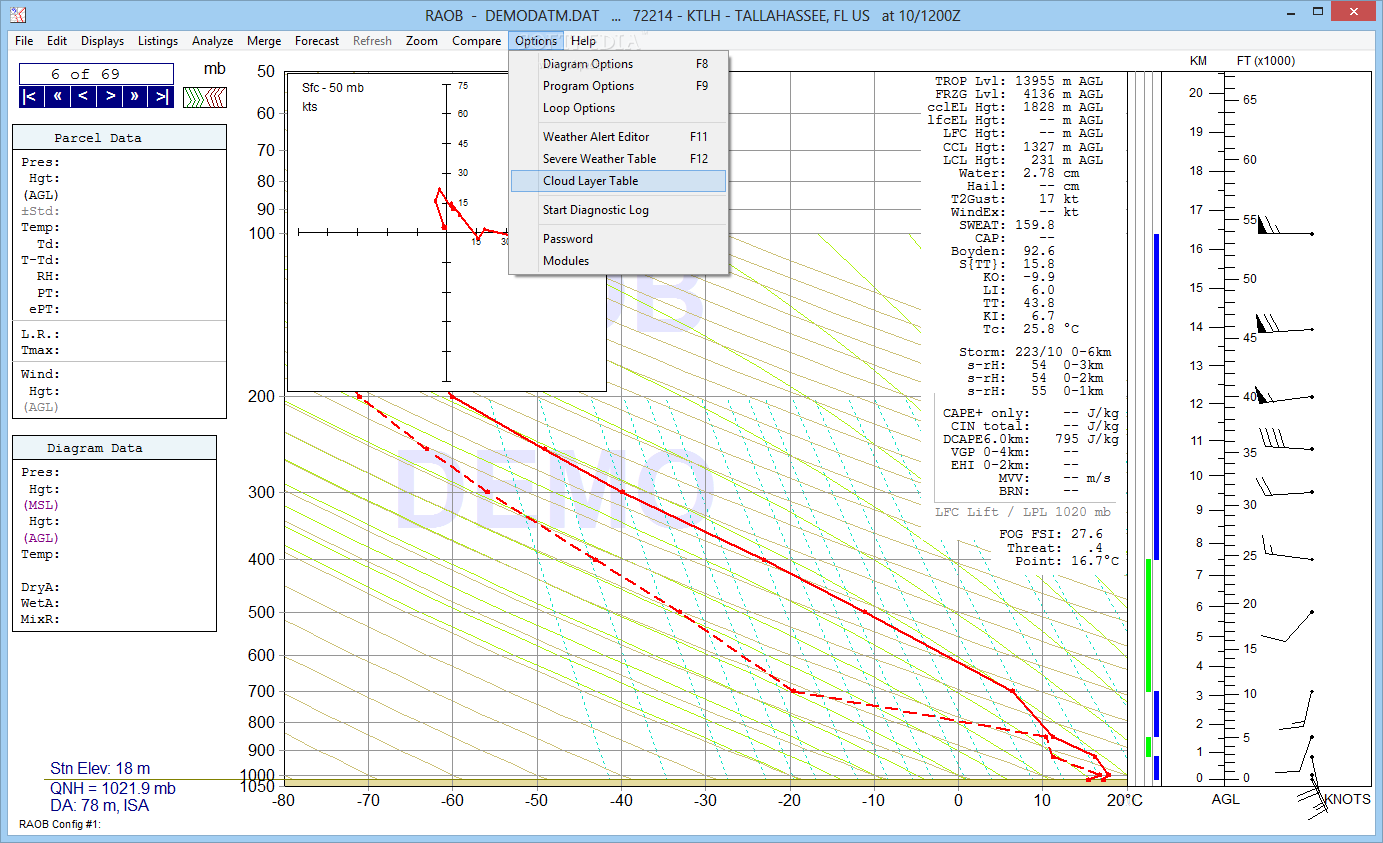
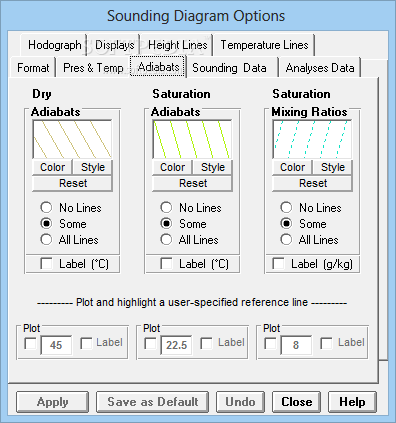
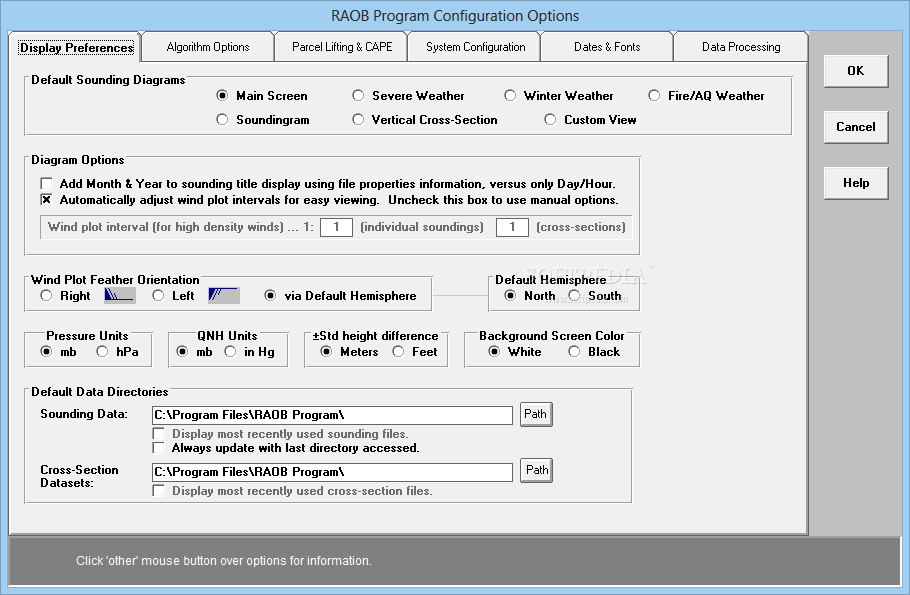
On the upper part of the UI, you can find a toolbar that contains helpful functions for your processes.
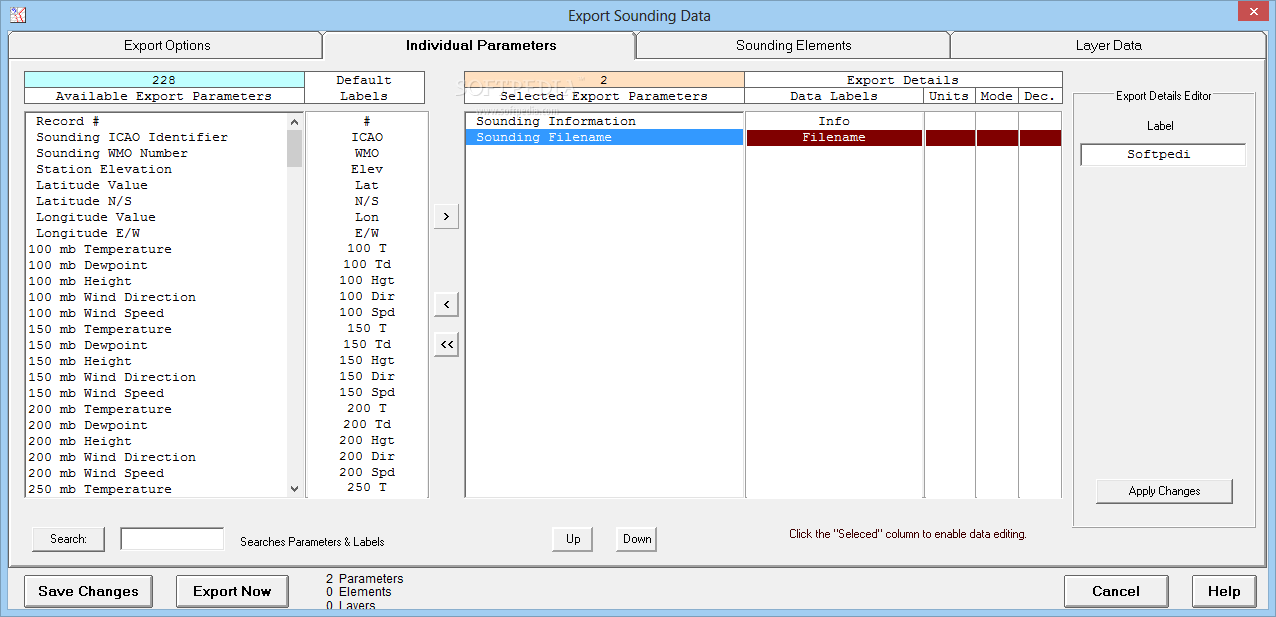
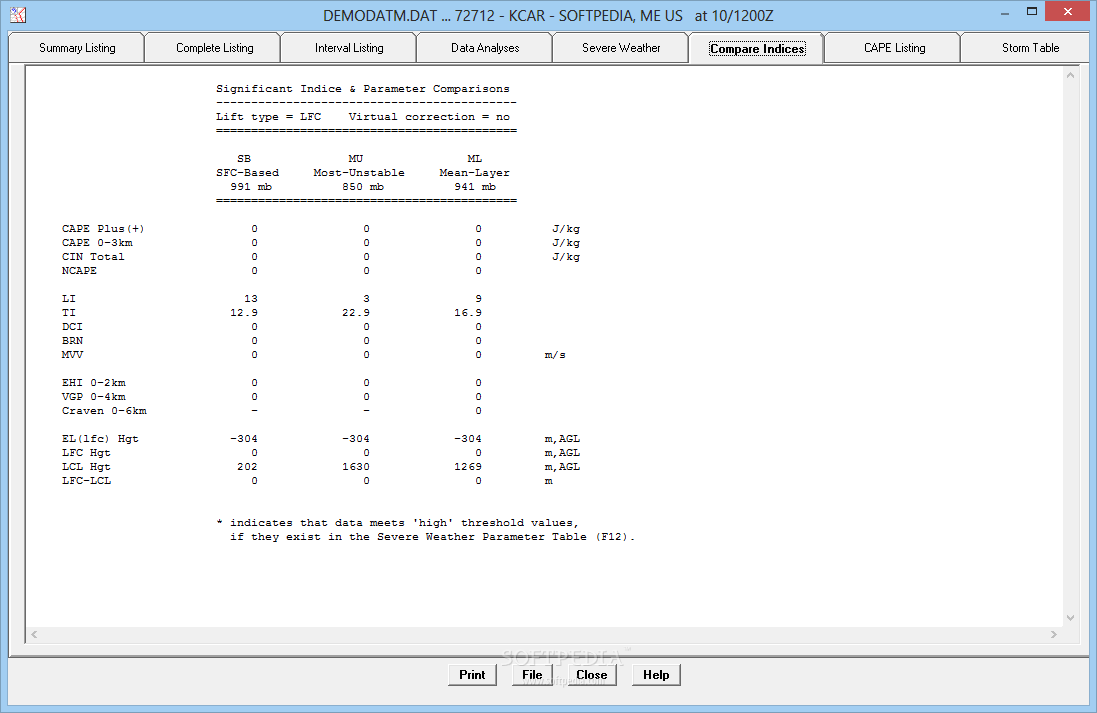
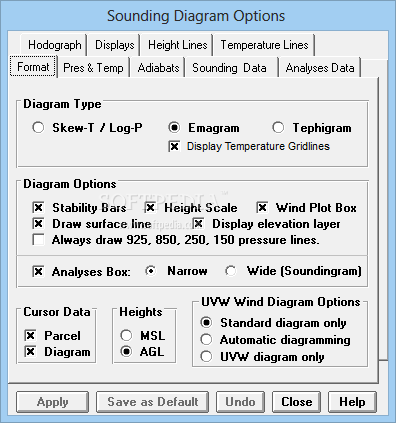
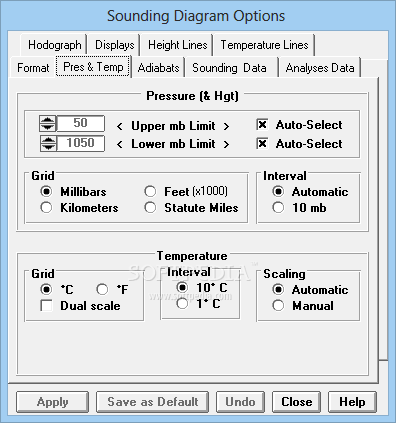
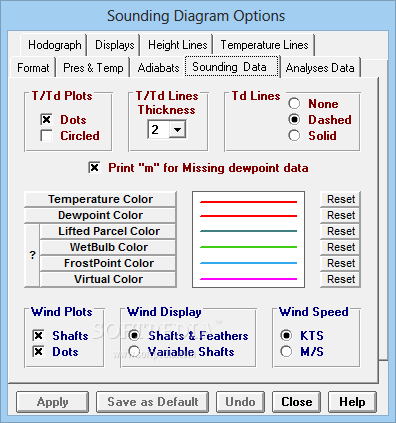
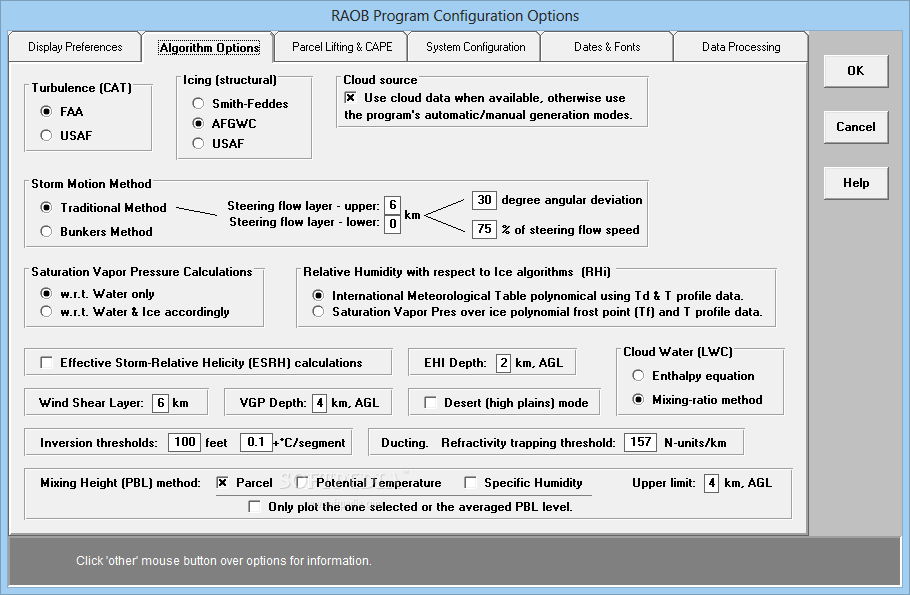
Regarding its main features, RAOB can independently configure twenty panels on one screen, merge two sounding it one file, identify the PBL's height, individually configure a sounding's key parameters and indices.
In conclusion, RAOB is a neat app that can decode a large quantity of data and interactively displays it using graphs.
User Reviews for RAOB FOR WINDOWS 1
-
for RAOB FOR WINDOWS
Jennifer Rodriguez: RAOB FOR WINDOWS is a powerful tool for decoding and plotting atmospheric data. Its modular design allows for seamless user customization.