
Description
iDebugger
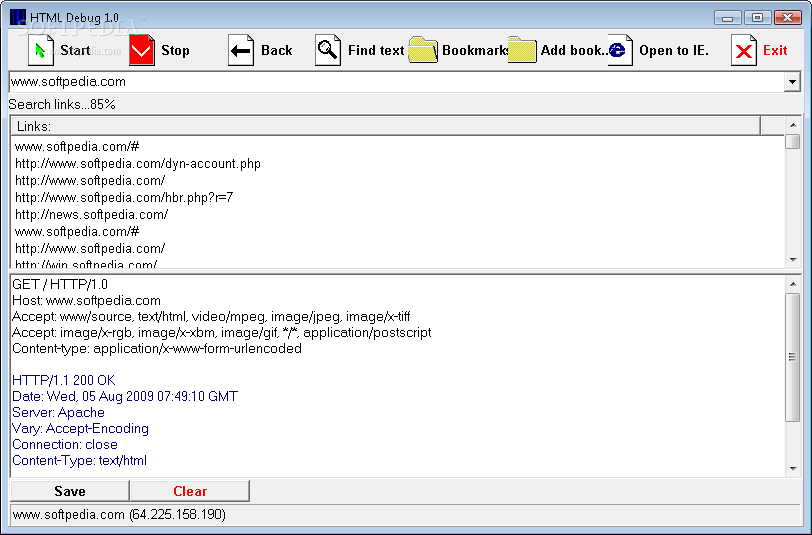
iDebugger is a handy tool that helps you easily navigate links in your documents. When you're using it, you'll notice that all the document links pop up right at the top of the screen. This means you can click on them without having to type anything into the address bar!
Easy Navigation with iDebugger
One of the cool things about iDebugger is how it shows you where everything comes from. At the bottom of your screen, you can see details like the document source, header info, and connection type. This makes it super easy to keep track of what you're working on.
Perfect for Debugging Wireless Apps
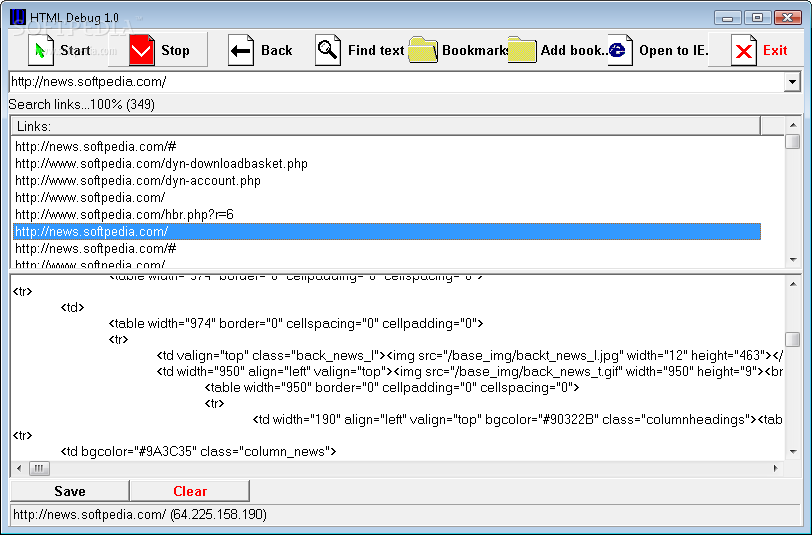
If you’re into debugging wireless applications like WAP or 3G, iDebugger is especially useful. Sometimes simulators just don’t cut it; they might not let you see the source code or may show messed-up content instead. That's where iDebugger really shines!
Get Started with iDebugger
If you're ready to check out more about iDebugger, it's a great way to streamline your debugging process and make everything easier to manage.
Why Choose iDebugger?
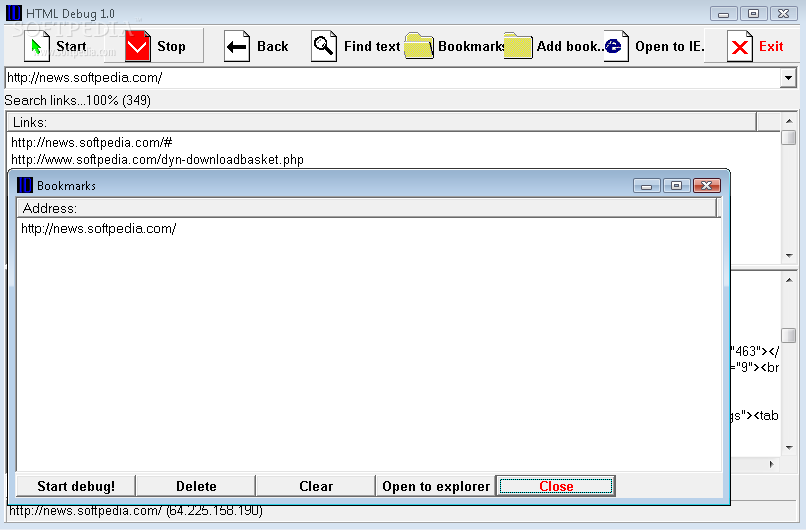
This tool makes working with documents a breeze! No more hassle with typing links manually or struggling to find where things are coming from. Whether you're dealing with web apps or wireless formats, having this utility by your side will save you tons of time.
User Reviews for iDebugger 1
-
for iDebugger
iDebugger's document link extraction and display features are efficient, enhancing the browsing experience for debugging wireless applications.