


Description
GlowCode
GlowCode is a super handy tool if you're worried about your app crashing due to memory leaks. Memory leaks happen when an application runs out of resources, and they can cause some serious headaches. If you're in the process of testing a new app, it's a great idea to check for any performance issues that could lead to crashes.
Easy Setup and User-Friendly Interface
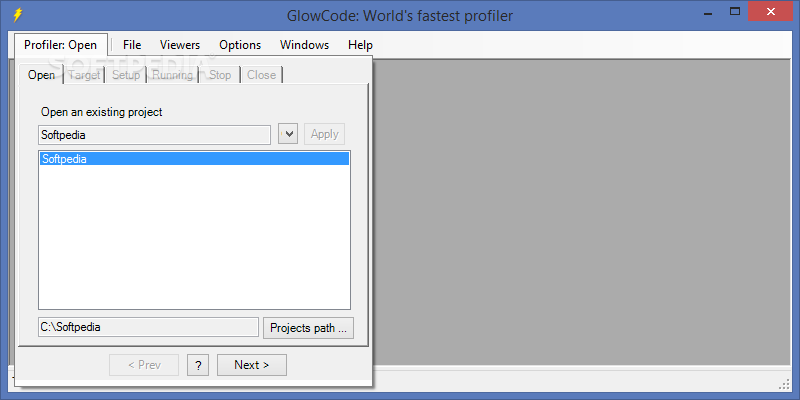
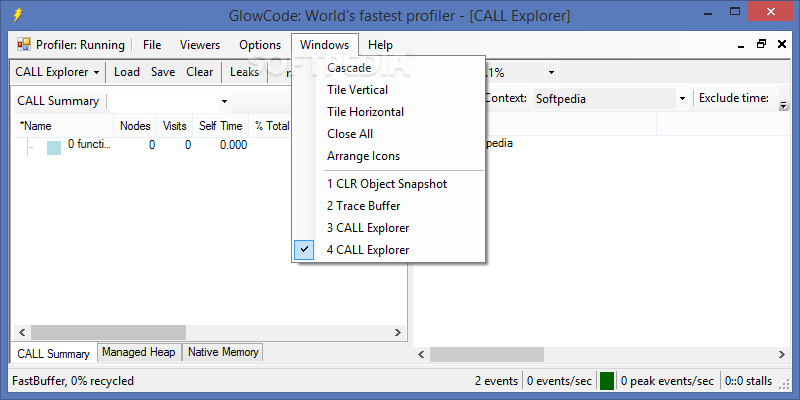
The installation of GlowCode is pretty straightforward. Just follow the steps in the wizard, and you’re good to go! The interface is simple and clean, making it easy to find all the main functions you need. You can launch the profiler and use different trackers to test your application.
Name Your Projects for Better Organization
A cool feature of GlowCode is that you can name your projects. This comes in really handy if you plan on running multiple tests with various tools to spot any resource issues or ways to optimize your app.
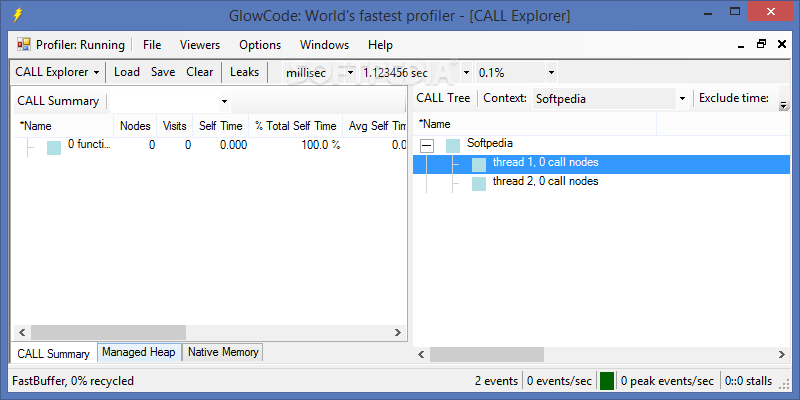
Save Your Profile Data Easily
Once you run your tests, GlowCode allows you to save your profile data in different formats like callExplorer, Trace Buffer, or CLR Object Snapshot. This depends on what tracking parameters you used during your testing. Plus, it works with native, mixed, and managed code!
Testing for Memory Leaks Made Simple
You can start testing for memory leaks as soon as you specify where your executable file is located along with a few parameters. After that, GlowCode will launch your applications and keep an eye on resource usage while they’re running.
Analyze Results with Color Indicators
If there are memory leaks happening (you’ll know because usage goes up while the app runs), then it’s time to take another look at the code or adjust the test settings. The utility shows results in a summary format using color indicators so you can quickly spot errors or bottlenecks before they become bigger problems.
Faster Development with Fewer Costs
In the long run, using GlowCode means faster project development with fewer unexpected costs popping up. Whether you're trying to cut down on development costs or just want to ensure everything's running smoothly before moving forward, GlowCode has got your back!
Tags:
User Reviews for GlowCode 7
-
for GlowCode
GlowCode offers a simple installation process and efficient memory leak detection. Its diverse tracking parameters make it a valuable tool.
-
for GlowCode
GlowCode is a game changer for developers! It effectively identifies memory leaks and performance issues.
-
for GlowCode
I love how easy GlowCode makes it to track down problems in my app. The interface is user-friendly!
-
for GlowCode
This app has saved me countless hours of debugging. Highly recommend GlowCode for any developer!
-
for GlowCode
GlowCode is incredibly efficient! It helped me pinpoint memory leaks quickly and improve my app's performance.
-
for GlowCode
Fantastic tool for developers! GlowCode simplifies the process of identifying and fixing resource issues.
-
for GlowCode
I couldn't be happier with GlowCode. It's intuitive, effective, and essential for optimizing my applications.