
Description
GDB
GDB, which stands for the GNU Project Debugger, is a free and open-source command-line tool that’s super handy for both users and developers. It lets you peek ‘inside’ another program while it’s running, helping you figure out why something might be crashing or misbehaving.
Key Features of GDB
This tool comes packed with some cool features! For starters, it offers four different ways to help developers catch bugs right when they happen. You can kick off an application and tweak things that might change how it runs. Plus, if your program hits a snag, GDB can make it stop at specific points so you can check what went wrong. You’ll also be able to look at logs to see what happened when things went south. Want to experiment? You can gradually alter parts of your program to fix issues without diving too deep into the code every time!
Supported Programming Languages
What’s great about GDB is its flexibility! It supports debugging programs written in a bunch of languages like C, C++, Pascal, Ada, Objective-C, and many more. This makes it a go-to choice for developers across various programming fields.
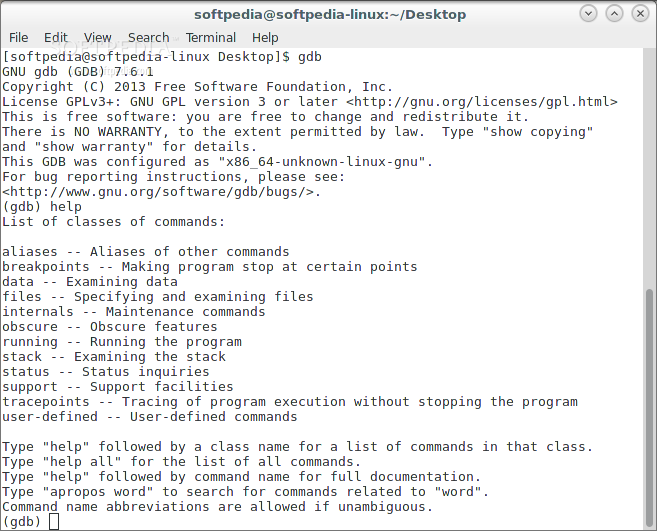
Using the Command-Line Interface
Keep in mind that GDB is all about the command line—it doesn't have a flashy graphical interface. To start using it, fire up a terminal emulator and run the “gdb” command. Once you’re there, just type “help” (no quotes) at the prompt to get started. If you want to see everything GDB can do, type “help all.” You can also check out specific commands by typing “help” followed by their name or search commands with “apropos word.”
Command Classes in GDB
When you hit that “help” command, you'll see various categories of commands pop up! These include:
- Aliases: Displays aliases for other commands.
- Breakpoints: Stops your program at certain points.
- Data: Lets you examine data closely.
- Status: For checking on the status of your application.
- User-defined: Create commands tailored just for you!
The list goes on! Each class helps with different aspects of debugging.
A Cross-Platform Tool
The best part? GDB is designed to work across multiple platforms! Whether you're on Windows or using popular Linux/UNIX variants, this tool has got your back. It runs smoothly on both 32-bit and 64-bit systems too!
If you're ready to give GDB a try and take control of your debugging process like a pro!
Tags:
User Reviews for GDB FOR LINUX 7
-
for GDB FOR LINUX
GDB FOR LINUX is a powerful open-source debugger for various programming languages. Its comprehensive features make bug-catching efficient for developers.
-
for GDB FOR LINUX
GDB is an exceptional tool for debugging! Its command-line interface is powerful and efficient.
-
for GDB FOR LINUX
Absolutely love GDB! It's a must-have for any developer looking to diagnose issues effectively.
-
for GDB FOR LINUX
GDB has transformed my debugging process. The features are robust and user-friendly!
-
for GDB FOR LINUX
This app is a lifesaver! GDB makes it easy to pinpoint and fix bugs in my code quickly.
-
for GDB FOR LINUX
GDB is simply the best debugger out there. It supports multiple languages and is super reliable!
-
for GDB FOR LINUX
I can't recommend GDB enough! Its comprehensive features help me understand my programs better.