
Description
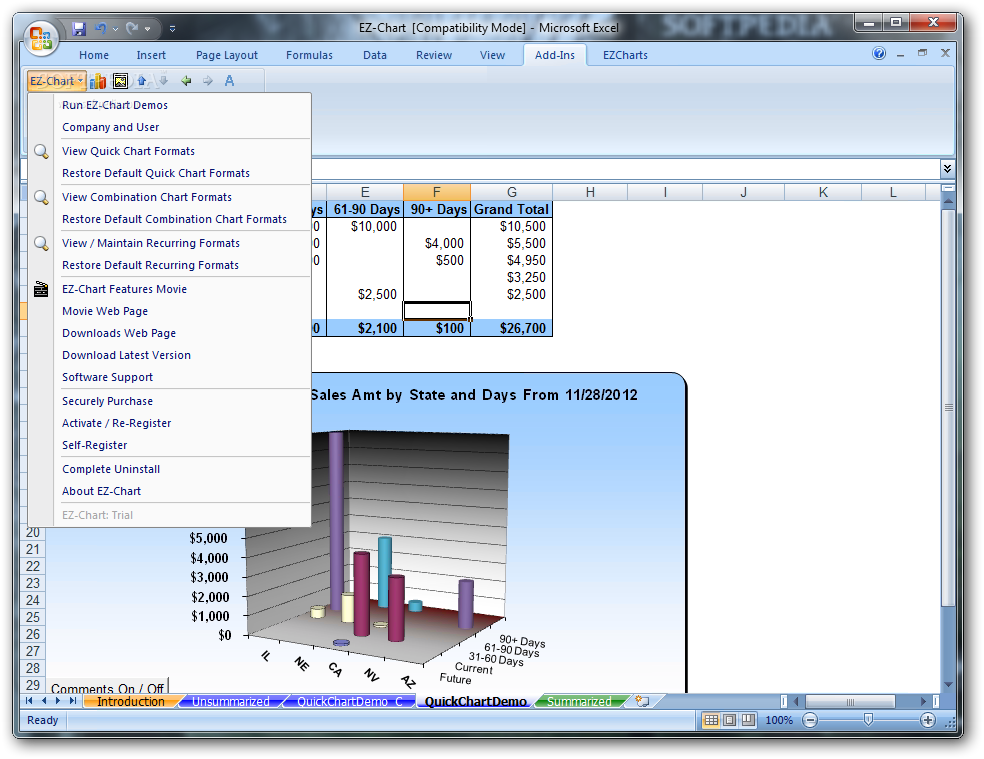
EZ-Chart for Excel
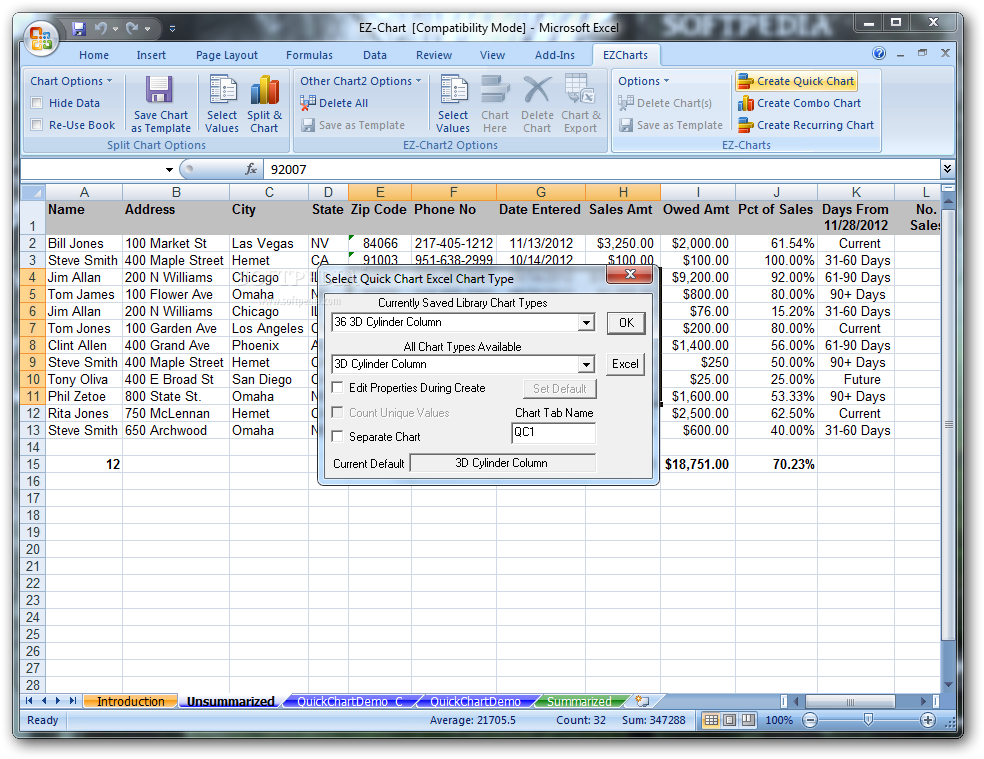
EZ-Chart for Excel is a super handy add-in that works with Excel. It helps you quickly summarize your data and whip up all kinds of charts. If you've got a bunch of data and need to make sense of it, this tool makes it easy!
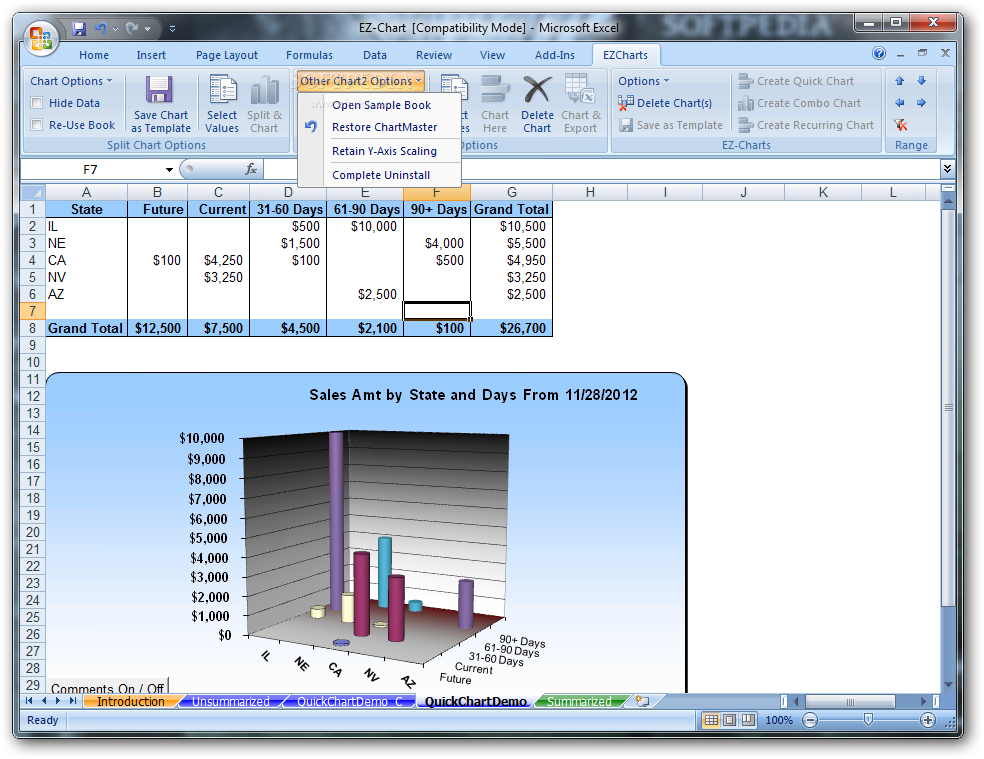
Summarize Data Like a Pro
With EZ-Chart, you can limit your chart data to show only records that have specific values in one or more fields. If your data isn't summarized yet, no worries! EZ-Chart will summarize the visible data before creating those cool charts.
Centering Made Easy
You can easily center your data and charts for a clean look when viewing or printing. No more awkward layouts!
No Pre-Summarizing Needed
The best part? You don't have to pre-summarize anything! Just pick your data and use the reusable EZ-Chart format. It's that simple!
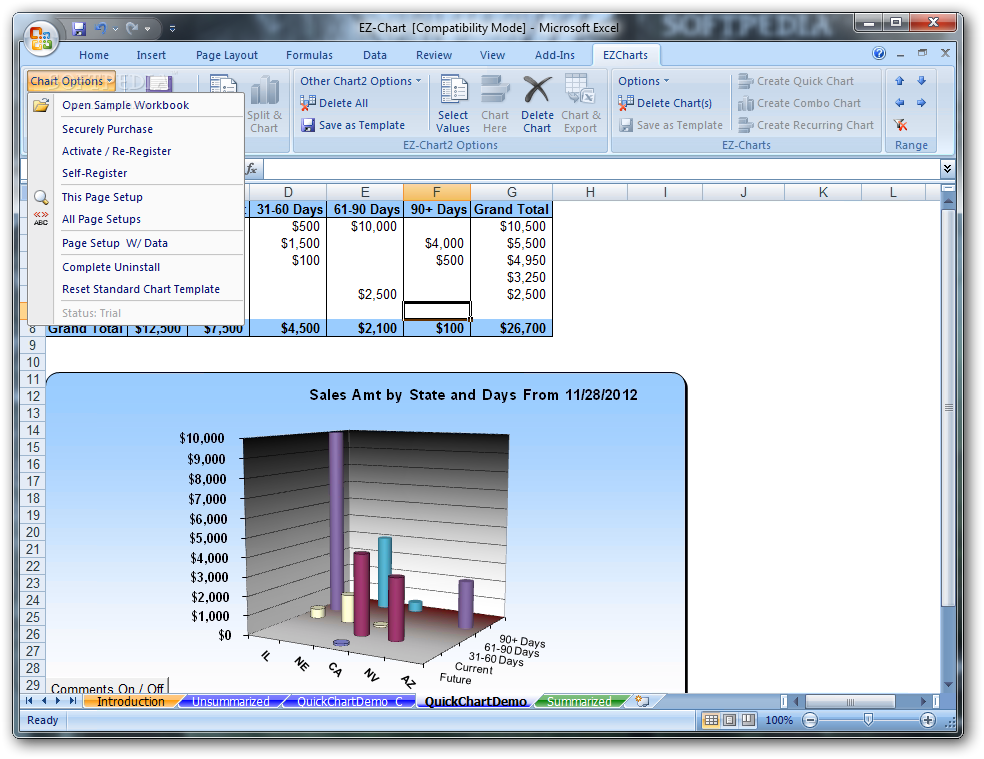
Customize Your Charts
Once you've selected the data, you can modify or choose which fields to chart, how many points to include, whether to show overflow totals, and how you want them sorted. These settings are part of every EZ-Chart format.
Change It Up Anytime
If you want to switch up chart types or customize your charts further, go right ahead! You can also adjust EZ-Chart's extra settings and save everything so it's ready for new data later on—whether it's the same fields or different ones.
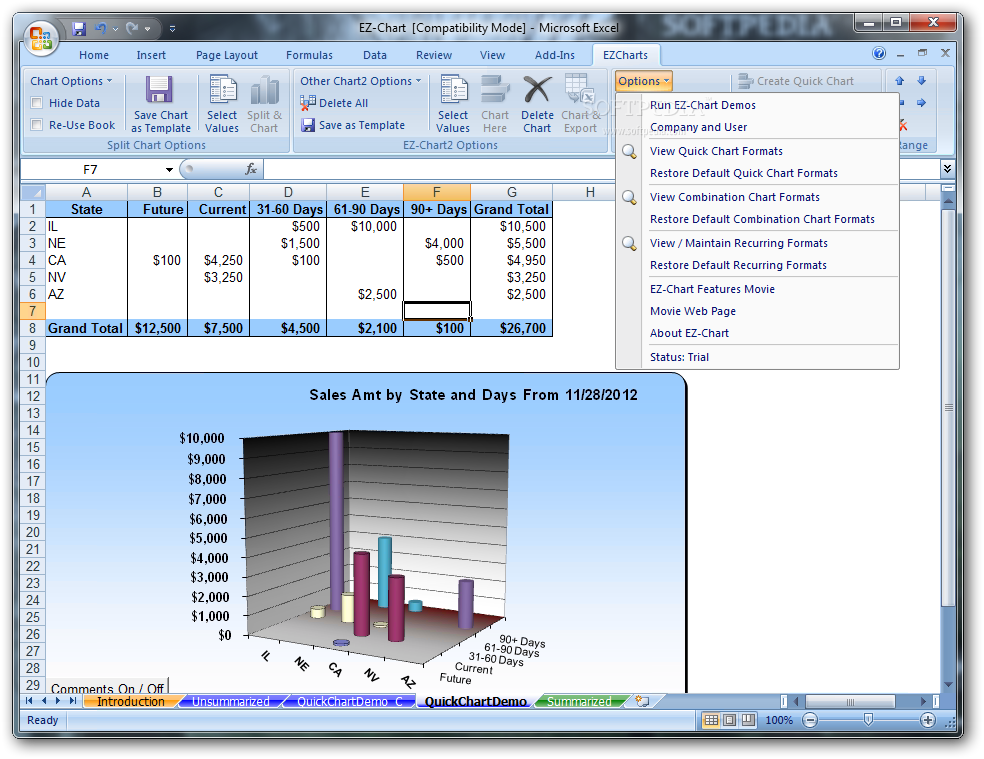
Easily Export Your Charts
Exporting charts is a breeze too. Share them with anyone who needs to see the insights you've gathered!
Create Custom Fields with EZ-Calc
If you're into accounting stuff like Aged Dates or Reformatted Dates, check out the separate EZ-Calc product. It's perfect for creating custom fields that work well in your charts.
Tags:
User Reviews for EZ-Chart for Excel 1
-
for EZ-Chart for Excel
EZ-Chart for Excel is a game-changer! Streamline data summarization and chart creation effortlessly. Customize and save formats for future use.