
Description
Studying and analyzing financial aspects, parameters and indicators that govern and characterize the stock exchange and its fluctuations can be difficult, and so is determining and isolating trends for the aforementioned elements. Specialized tools for such tasks employ a variety of techniques, most of which are focused on the evolution of the given financial parameters across a set timeline.
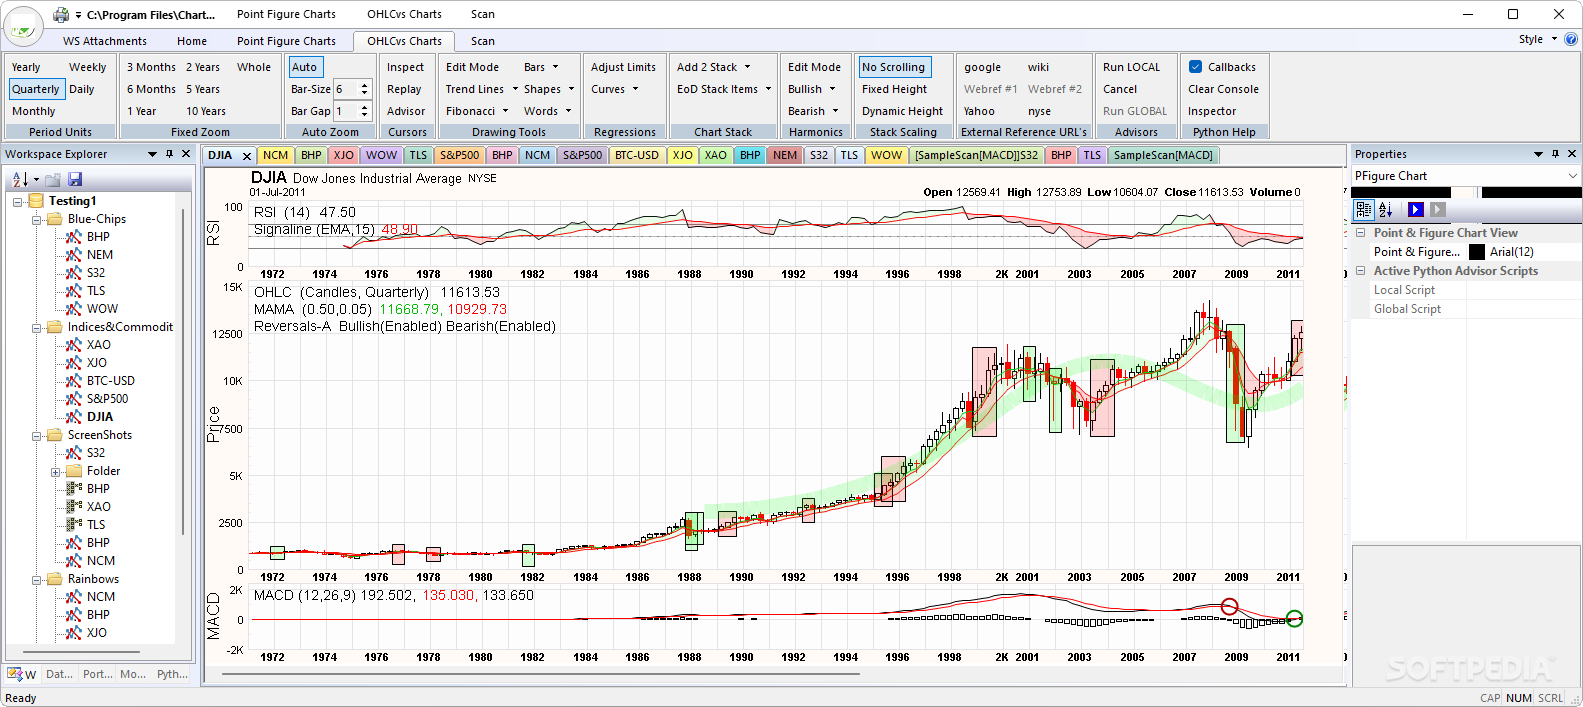
This, and much more, is at the core of Chartboard, which was designed specifically in order to provide users with specialized means for performing a technical analysis regarding charting trends for the multiple parameters that characterize the financial fluctuations encountered in stock and other markets.
The main design of the application relies on a ribbon-style layout, which prioritizes quick access and offers multiple tabs for controlling the elements and information that are used for plotting and identifying trends.
A variety of indicators, as well as elements, are catered for, including markups, regression curve fitting, drawing tools, portfolio integration, trade modeling, robo signals, market replay, advisor and stock scanning, and many more.
Period units are provided, in a multitude of increments, and chart categories span across classic OHLC with overlays, or point and figure variants, with traditional, percentile, and manual displays.
User Reviews for Chartboard FOR WINDOWS 1
-
for Chartboard FOR WINDOWS
Chartboard FOR WINDOWS offers specialized tools for in-depth financial analysis, featuring a ribbon-style layout for quick access and a wide array of indicators.