
Description
YourKit Java Profiler
YourKit Java Profiler is a handy profiling tool made just for Java developers. If you’re looking for a reliable app to help with CPU and memory profiling, this is it!
Key Features of YourKit Java Profiler
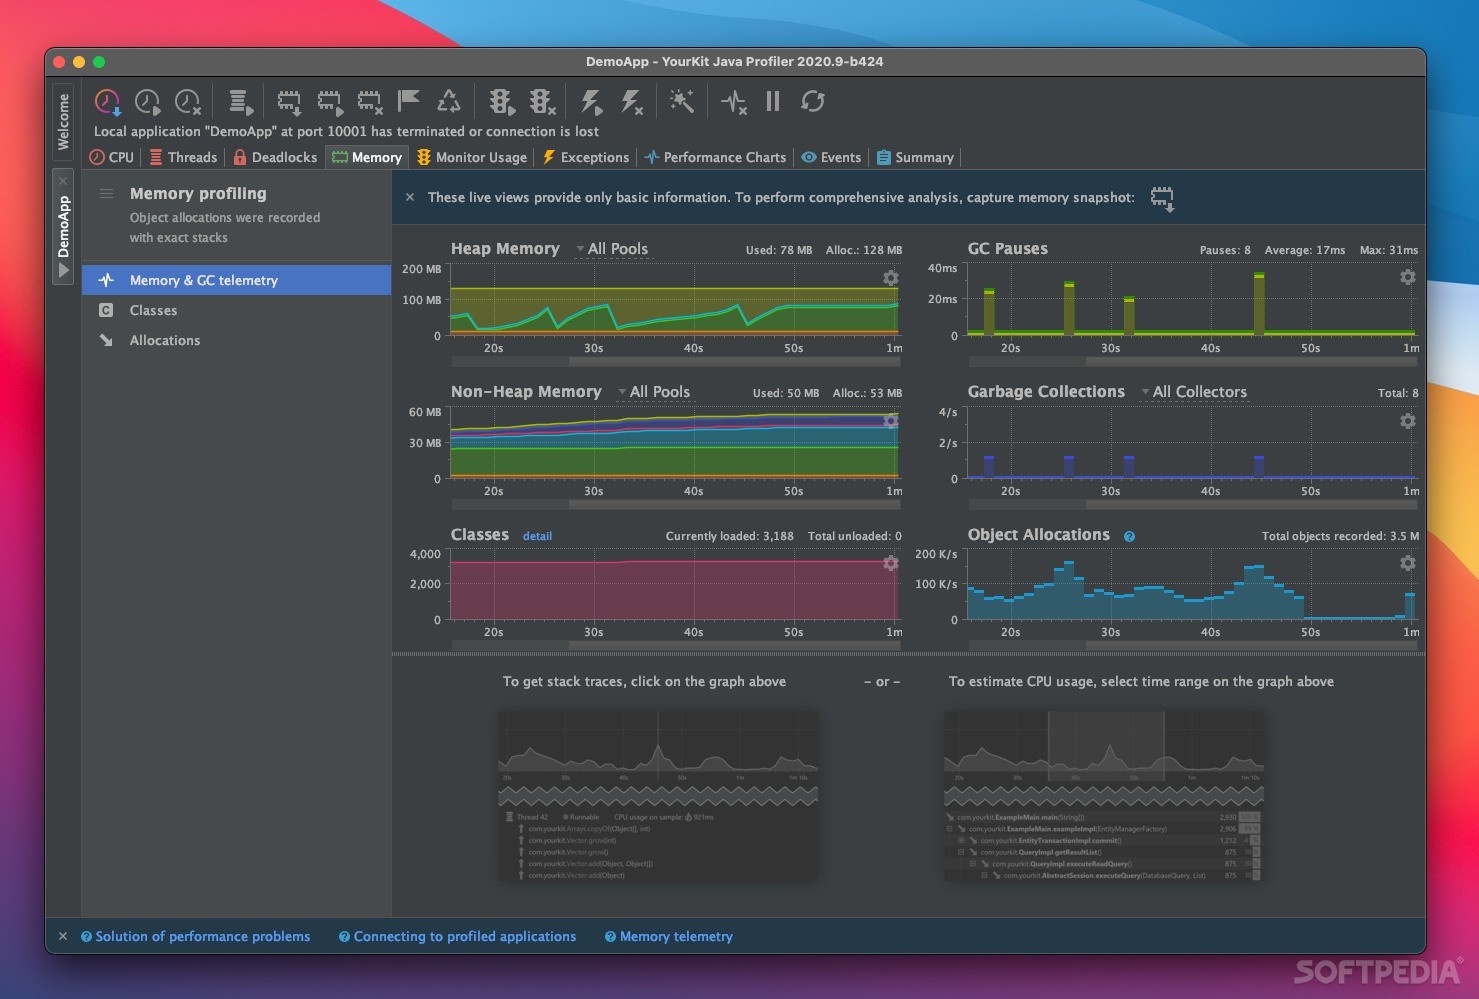
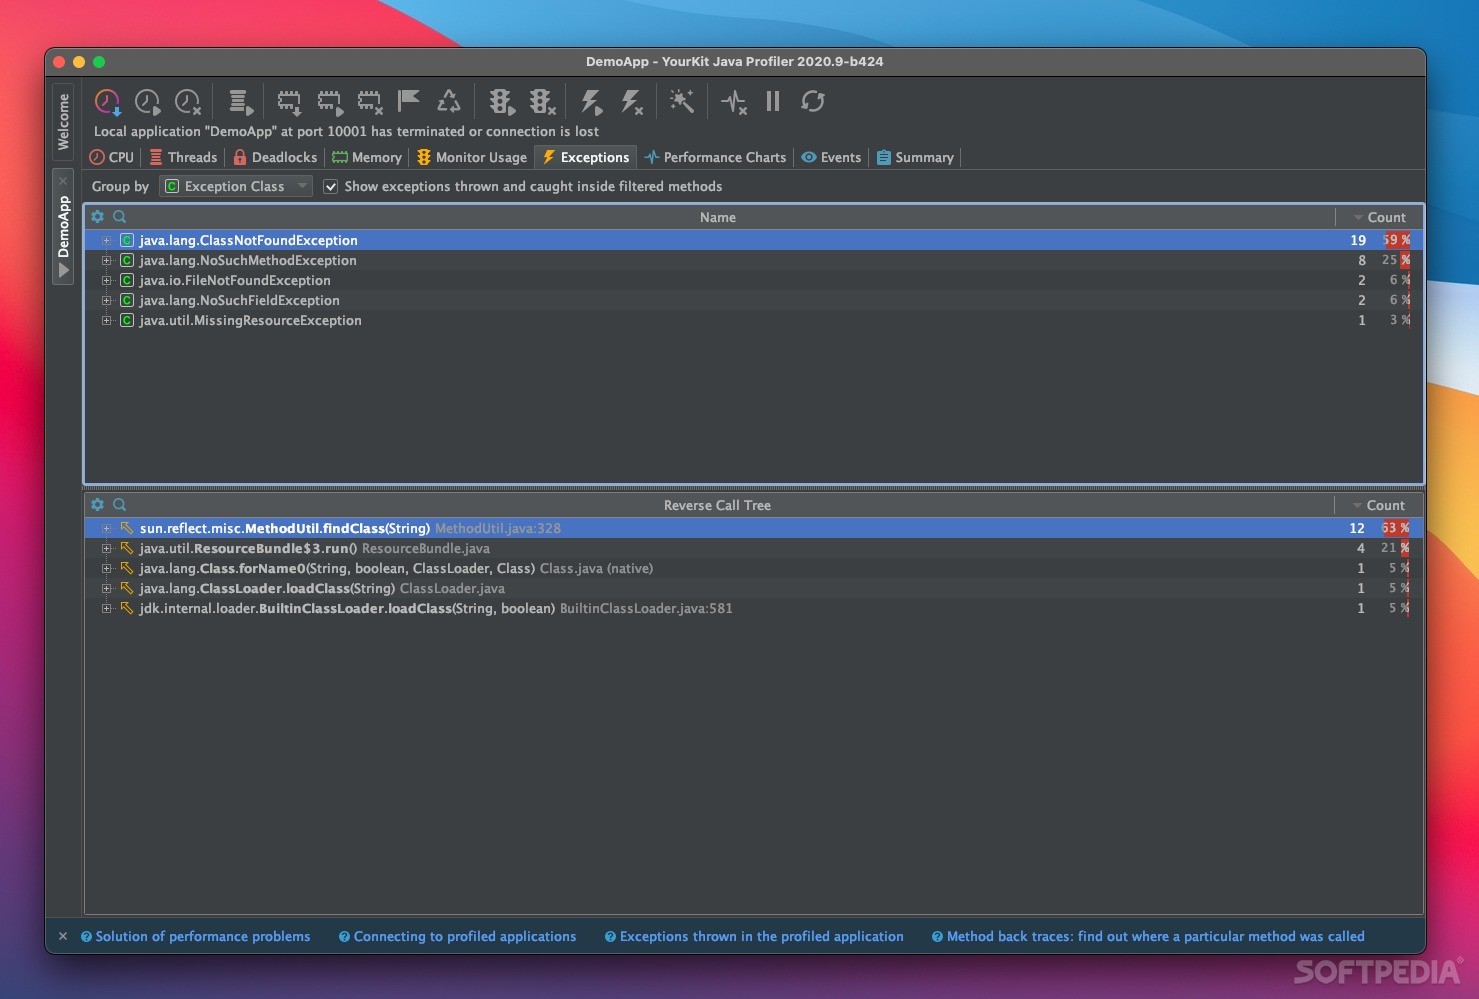
What’s cool about YourKit Java Profiler is its powerful analysis features. You can easily spot CPU and memory hot spots, compare different aspects, find memory leaks, and even create memory distribution reports. Plus, it helps you measure the shallow and retained size of objects.
On-Demand Profiling
Another neat feature is On-demand profiling. This lets you enable profiling only when you need it. So your application can run at full power the rest of the time! You can check the current heap state whenever you want by capturing memory snapshots.
Getting Started
Getting started with YourKit Java Profiler is super easy! Just download the light archive, extract the application to a place that works for you, and you're all set. It also integrates smoothly with most popular IDEs and application servers.
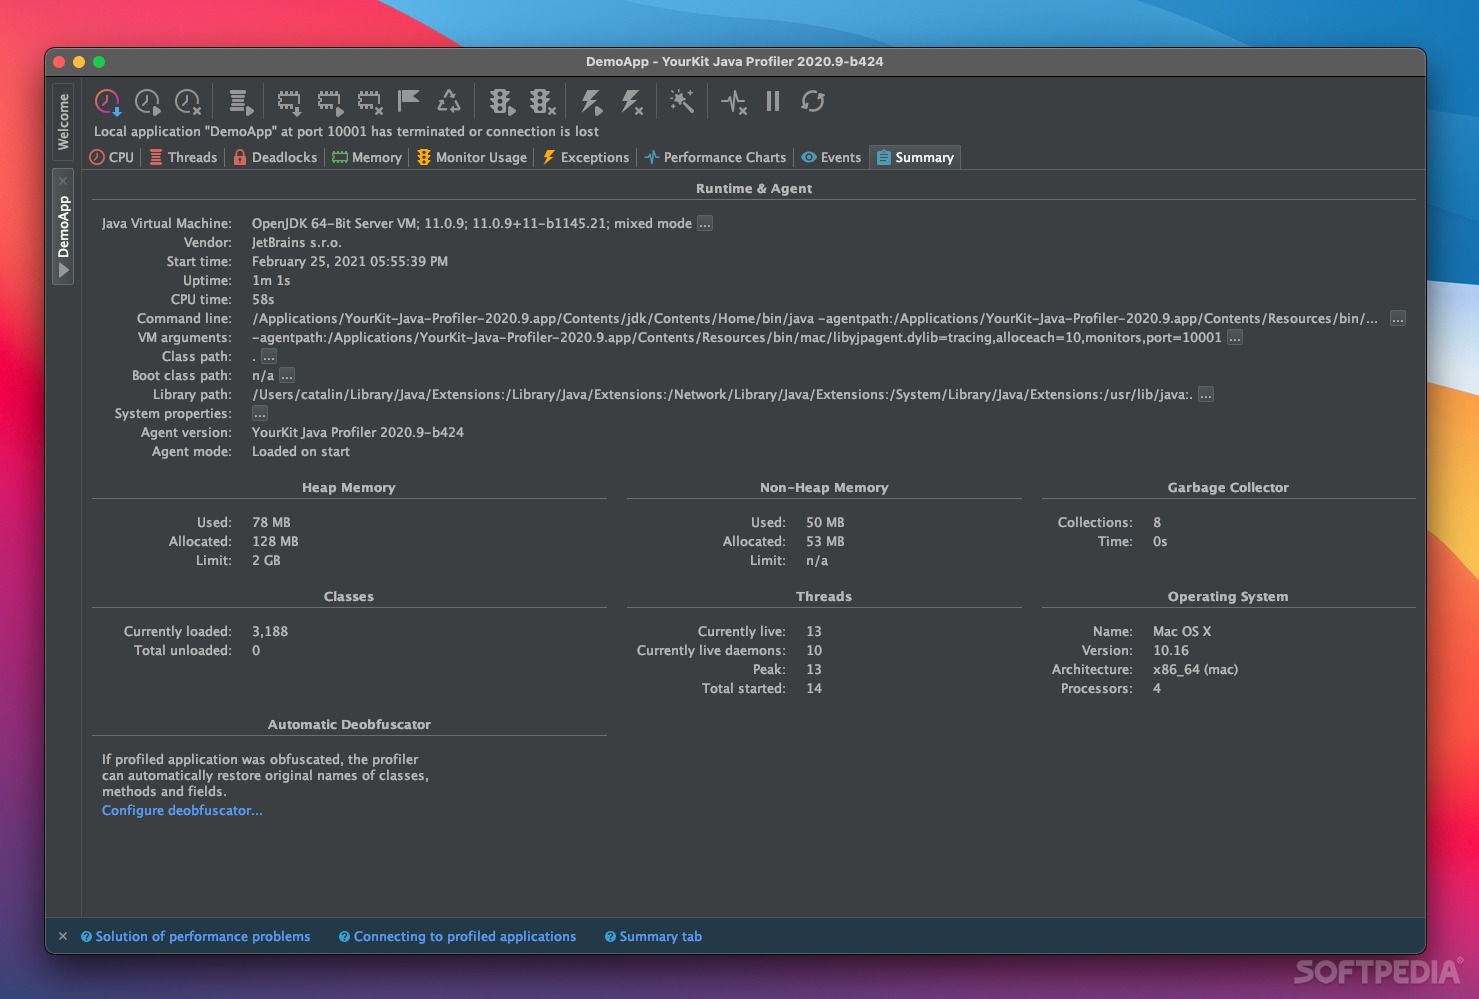
User-Friendly Interface
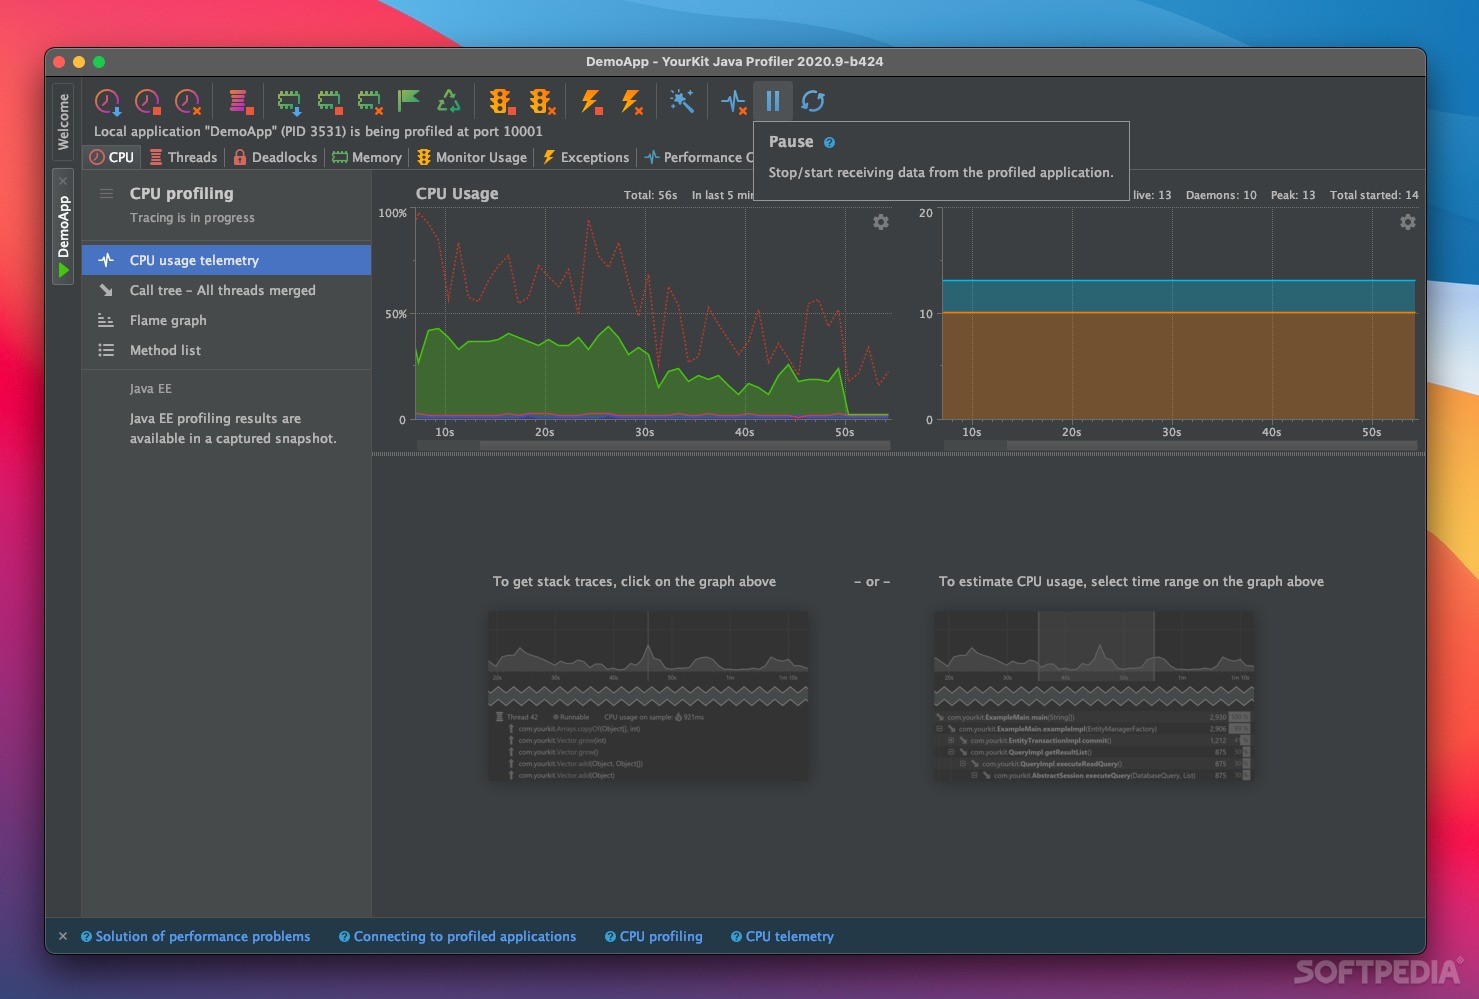
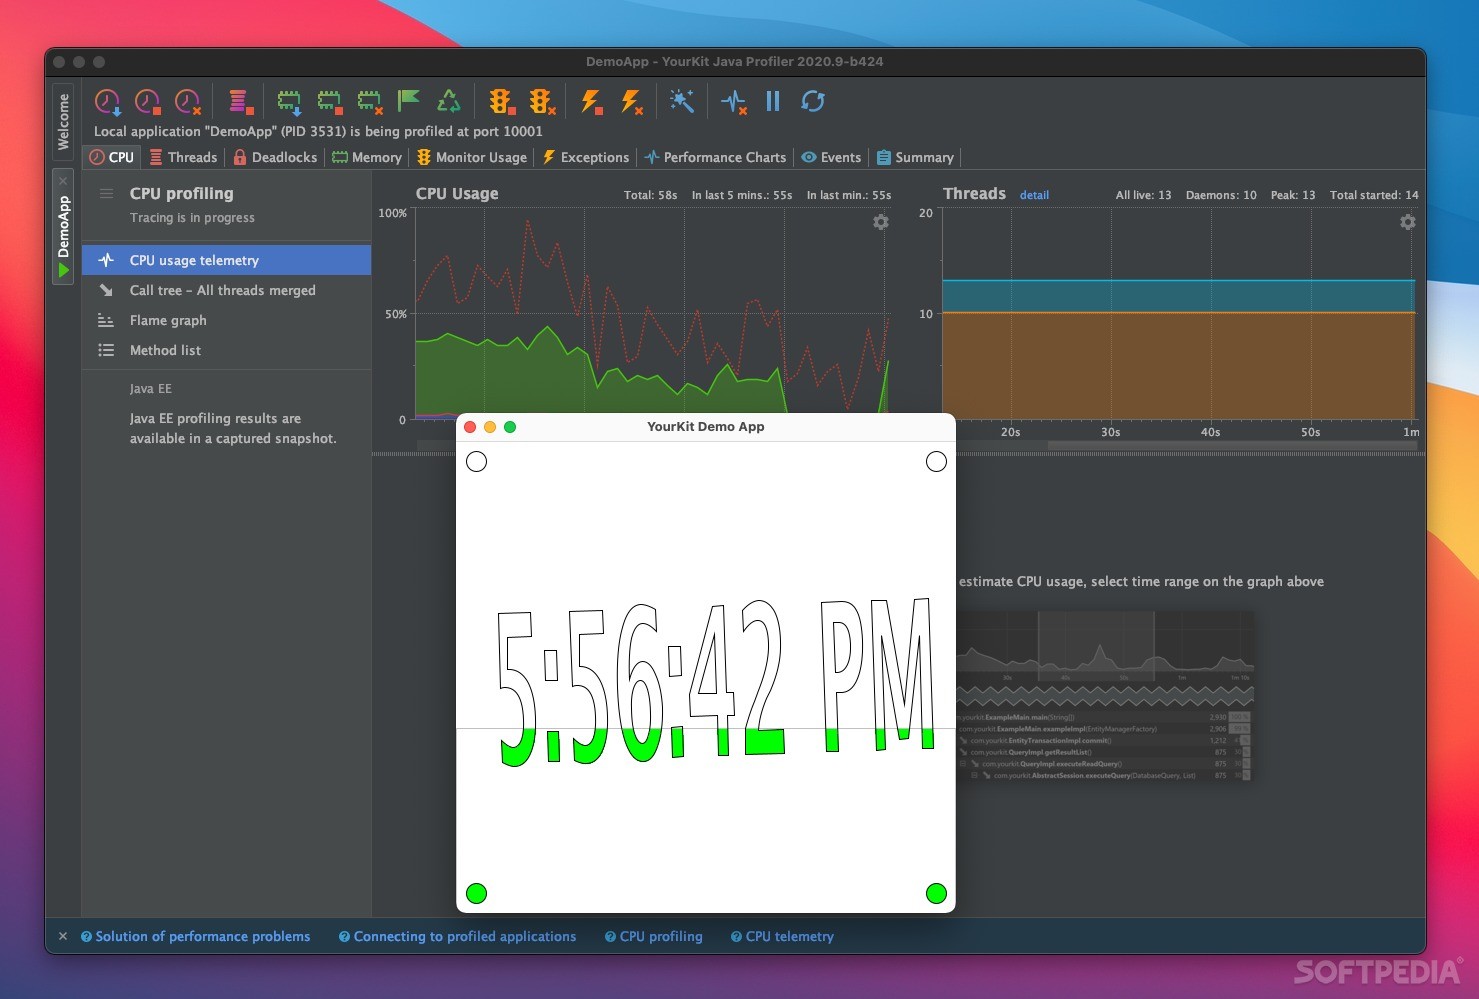
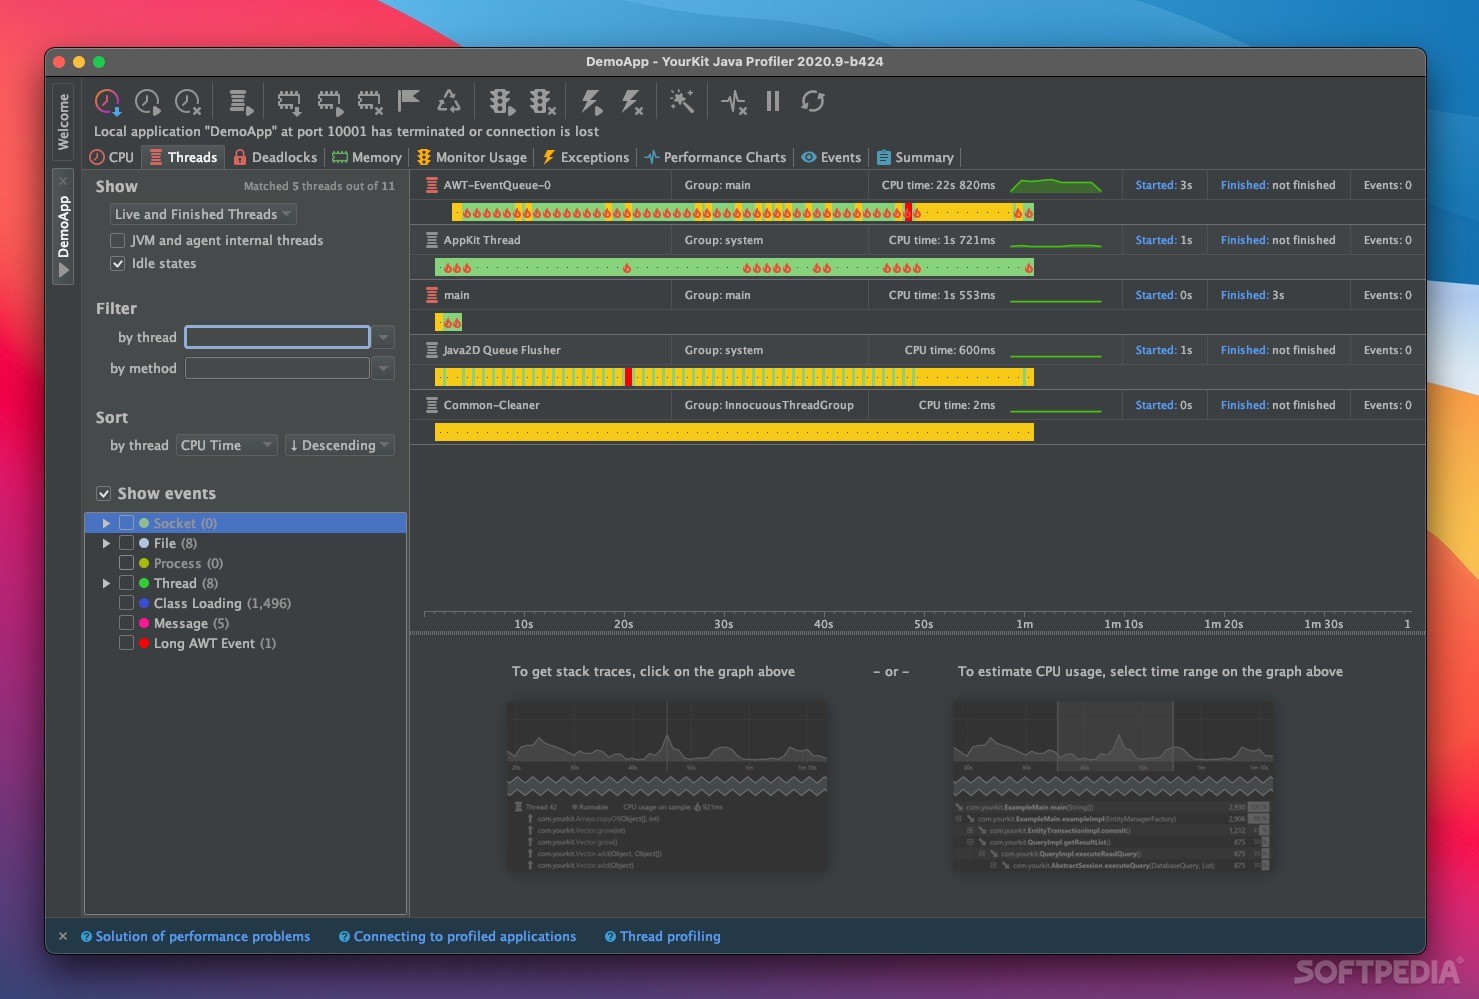
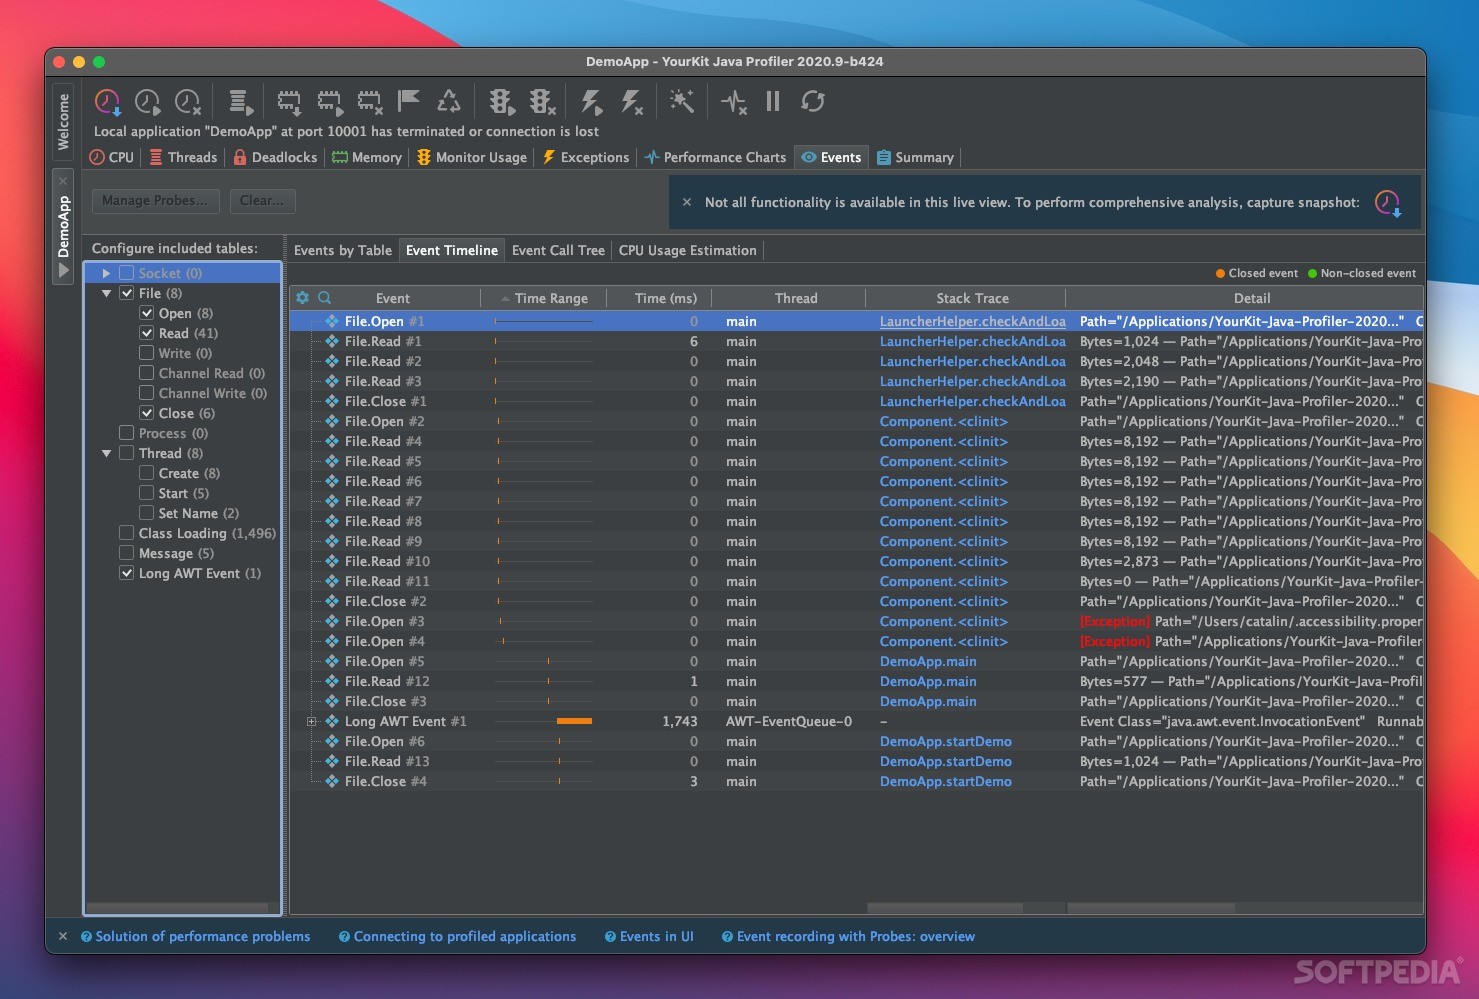
The user-friendly interface makes it simple to navigate. It supports keyboard shortcuts and has report filtering for quick analysis. You’ll find a top toolbar that helps you capture performance snapshots, start or stop CPU profiling, clear results, disable stack telemetry, capture memory snapshots, record memory allocation, and much more!
Customizable Actions
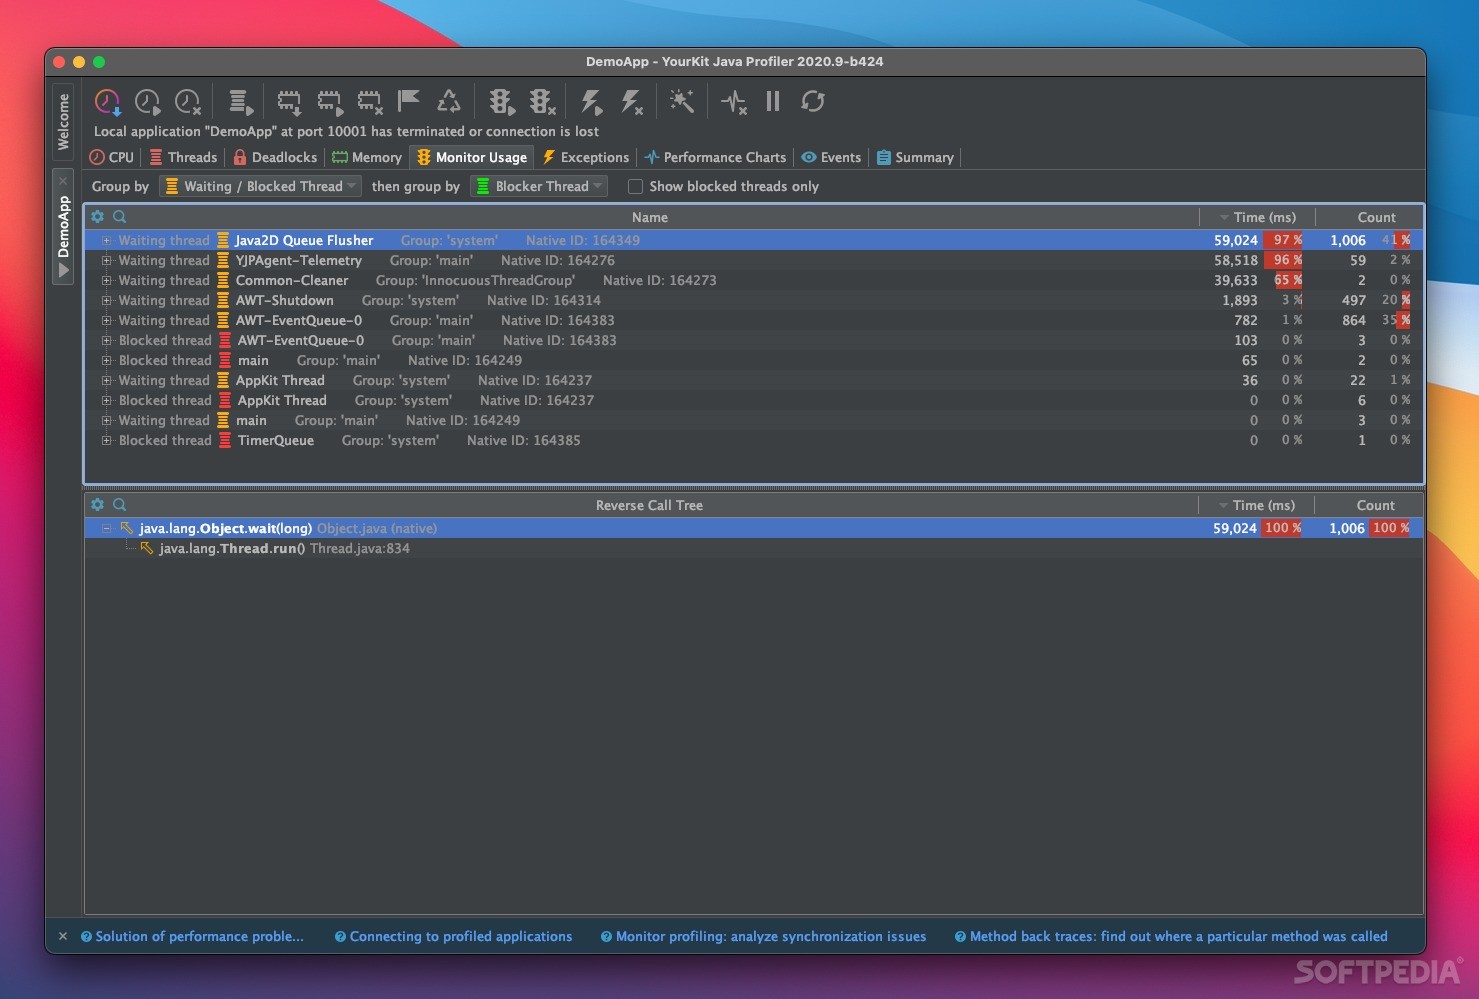
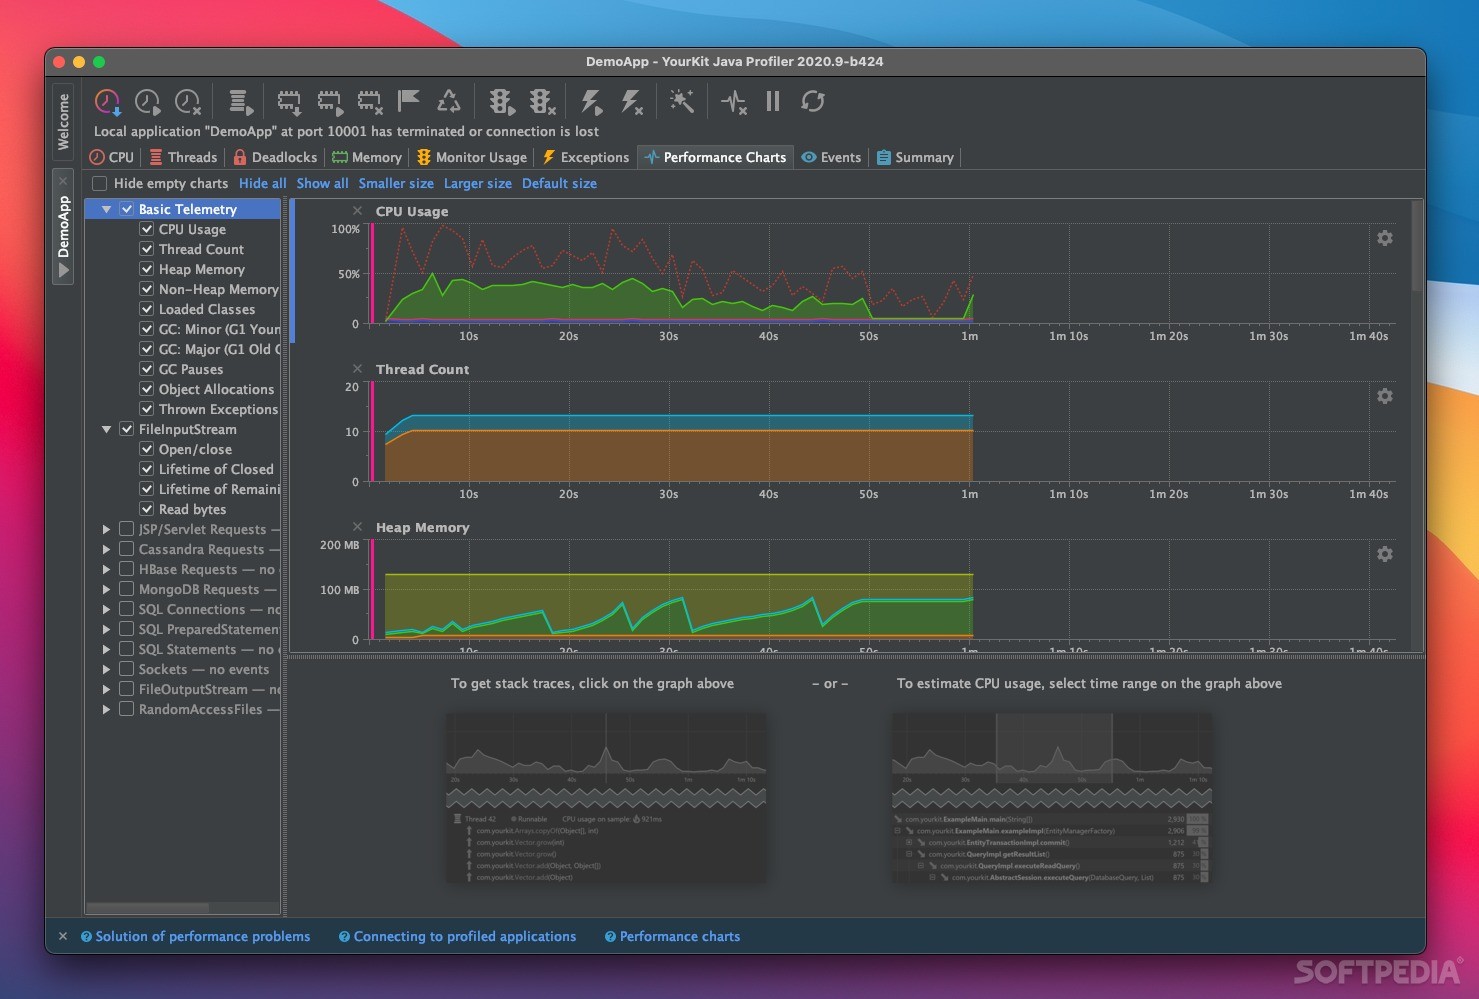
You can even set up actions that trigger based on certain events like high CPU or memory usage or when a specific method runs. The graphs in the CPU, Threads, and Memory tabs update in real time so you can keep an eye on everything.
Monitor Everything Effortlessly
This means you can easily monitor CPU usage, thread count, heap memory, non-heap memory, loaded classes along with minor and major collections.
If you're ready to dive in and see what YourKit Java Profiler can do for your projects, check it out here!
Tags:
User Reviews for YourKit Java Profiler For Mac 7
-
for YourKit Java Profiler For Mac
YourKit Java Profiler FOR MAC offers robust CPU and memory profiling tools with invaluable analysis capabilities and convenient on-demand profiling feature. Excellent for Java developers.
-
for YourKit Java Profiler For Mac
YourKit Java Profiler is an incredible tool! It helps me pinpoint performance issues quickly.
-
for YourKit Java Profiler For Mac
Absolutely love the on-demand profiling feature. It's made my debugging process so much smoother!
-
for YourKit Java Profiler For Mac
This app offers fantastic analysis capabilities. The memory leak detection has saved me countless hours.
-
for YourKit Java Profiler For Mac
YourKit's integration with IDEs is seamless! The user interface is intuitive and easy to navigate.
-
for YourKit Java Profiler For Mac
The real-time graphs are a game changer for monitoring performance. Highly recommend this profiler!
-
for YourKit Java Profiler For Mac
A must-have for any Java developer. It provides detailed insights that help optimize my applications efficiently.