


Description
Microsoft Power BI Desktop
Microsoft Power BI Desktop is a super handy tool for data analytics and reporting. It's like your best buddy when it comes to using Microsoft’s Power BI service. With this software, you get awesome interactive data visualization tools and cool data querying features that help you whip up professional-looking reports. You can easily share these reports with your business partners and customers!
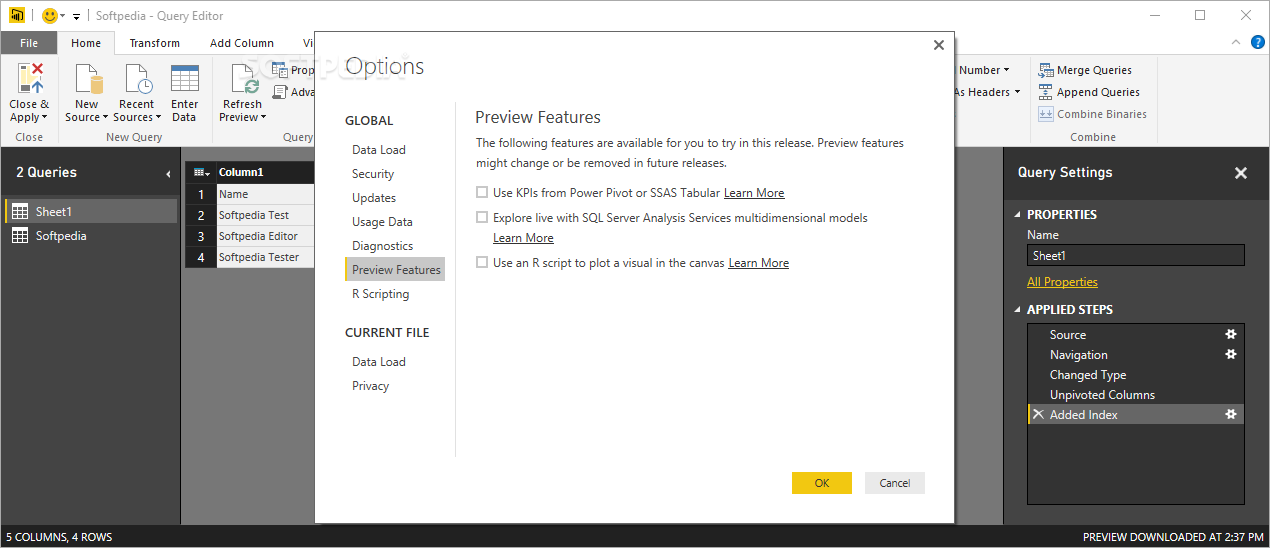
Easy-to-Use Interface
If you're familiar with other Microsoft apps in the Office suite, you'll feel right at home with Power BI Desktop. The interface is designed for simplicity, giving you one-click access to all the data importing and visualization tools you need. Plus, there’s a spacious multi-page workspace where you can drag and drop elements around however you like.
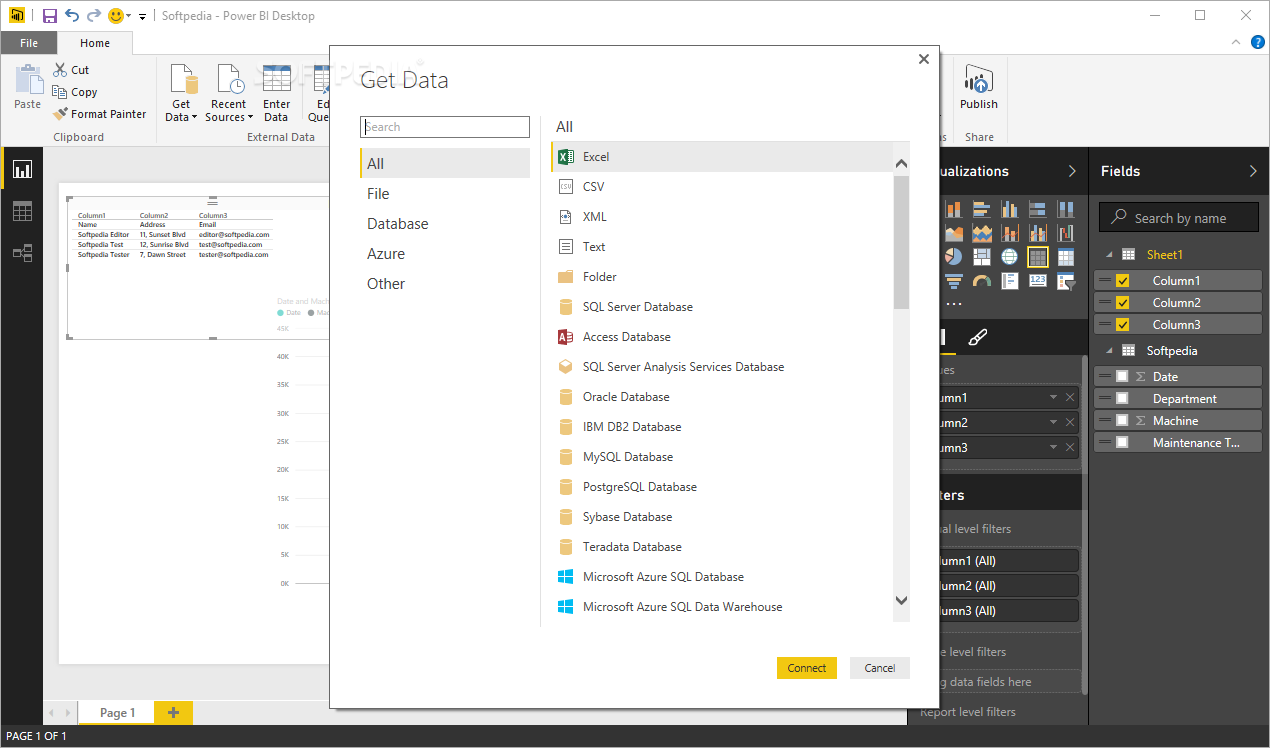
Supports Various Data Sources
One of the coolest things about Power BI Desktop is its ability to connect to tons of different data sources! Whether you're working with Excel workbooks, CSV files, or text documents, it has got you covered. It supports databases like SQL Server, Access, Oracle, MySQL, PostgreSQL, and more! You can also pull in data from SharePoint, Active Directory, Google Analytics, Salesforce—you name it! And if that's not enough flexibility for you, there's even an option to enter your data manually!
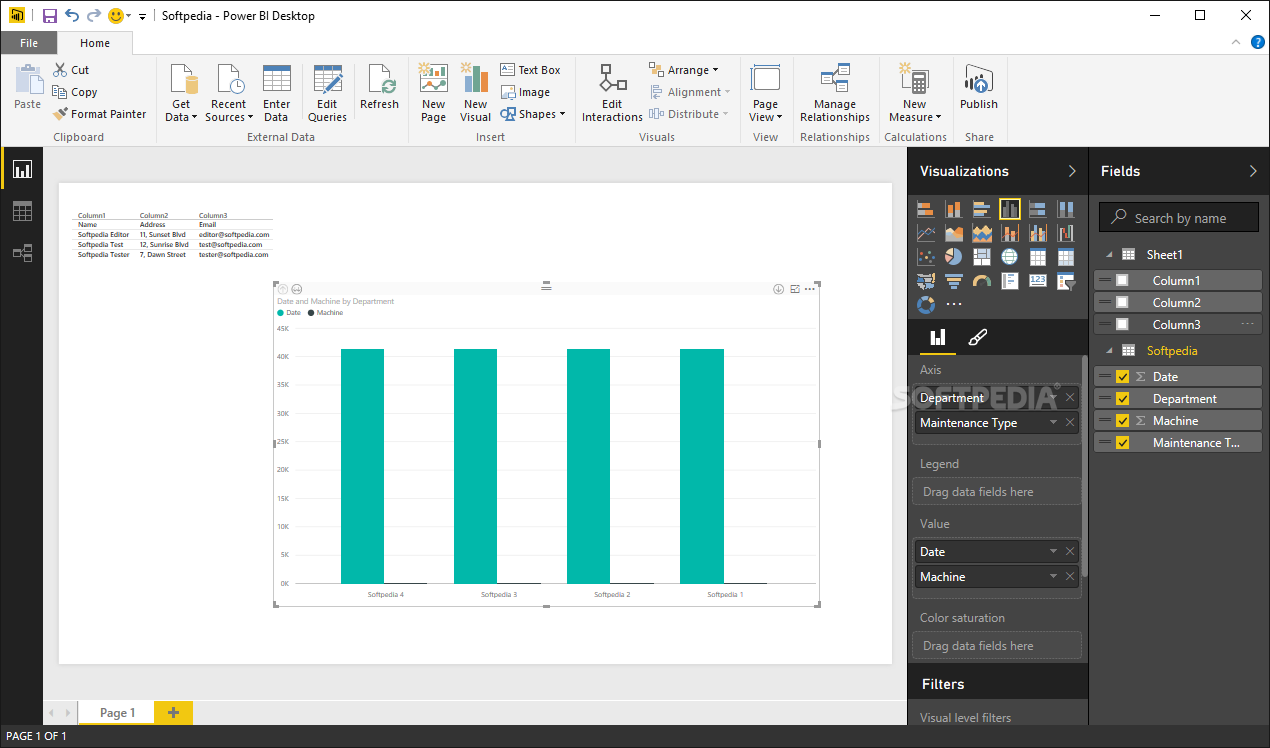
Create Stunning Visuals
This tool makes reporting so much easier by transforming complex data into visual formats that are easy to digest. You’ll find all sorts of graphs and charts available—maps, cards, gauges—you can even import custom visuals if you want something unique.
Customize Your Reports
Power BI Desktop lets you customize every aspect of your charts with just one click! Want to tweak the axis data or change the colors? No problem! You can choose which fields to include or leave out in your charts too. There’s also room for adding text boxes, images, or shapes to make your reports pop.
Modern Look & Large Data Handling
This software boasts a modern interface that's easy on the eyes and user-friendly. It handles large datasets from various sources effortlessly and combines them into one comprehensive report that can be shared via the Power BI platform. Just a heads-up though: reports can't be saved in other formats unless you're looking to publish them online.
Tags:
User Reviews for Microsoft Power BI Desktop 1
-
for Microsoft Power BI Desktop
Microsoft Power BI Desktop offers powerful data visualization tools and extensive data source support. Ideal for creating professional reports.