
Description
Magnitude-Frequency Distribution Plotter
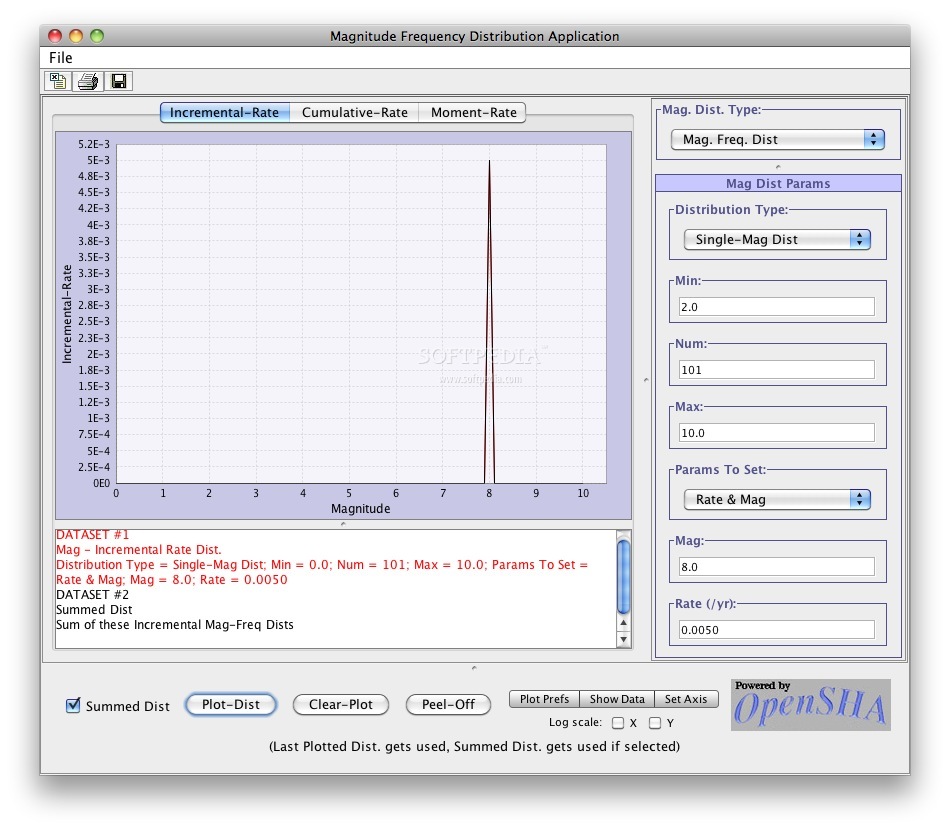
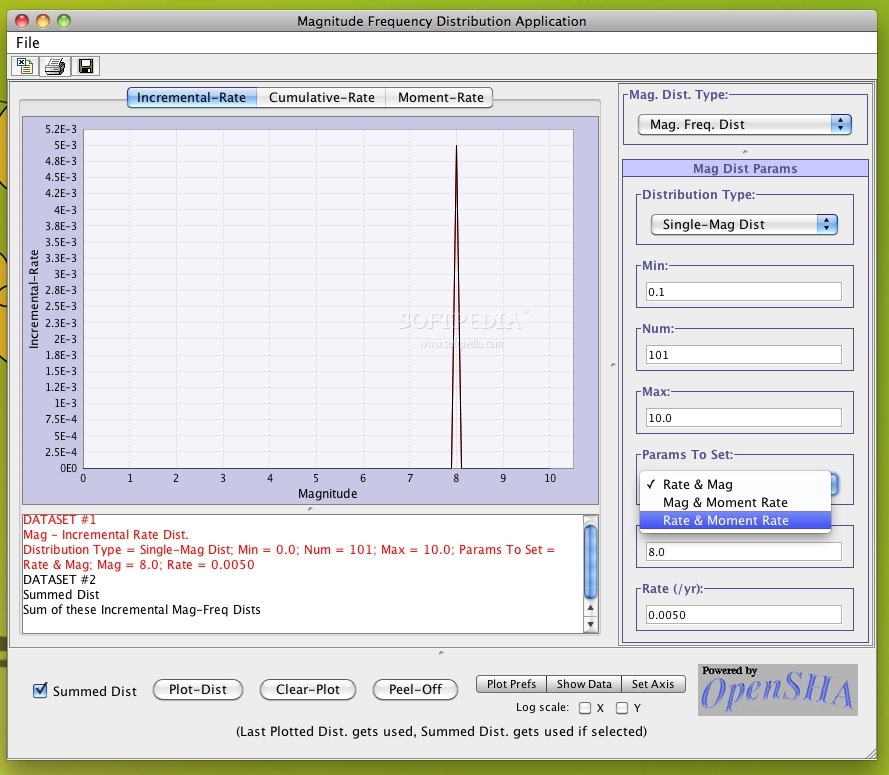
Magnitude-Frequency Distribution Plotter is a cool, free app that helps you visualize the magnitude-frequency distributions of earthquake magnitude PDFs. It’s super handy if you’re into studying earthquakes or need to analyze data related to them.
What Can You Do with This App?
This software lets you create plots that show how often certain magnitudes of earthquakes occur. It’s a straightforward tool that's perfect for anyone who wants to get a better grasp on earthquake data without getting too technical.
Cross-Platform Compatibility
No matter what system you’re using, you’re in luck! The Magnitude-Frequency Distribution Plotter is written in Java, which means it runs smoothly on Mac OS X, Windows, and Linux. So whether you're at work or home, you'll have access to this great tool!
Why Use the Magnitude-Frequency Distribution Plotter?
If you're looking for an easy way to plot your earthquake data, this app is worth checking out. Not only is it free, but it's also user-friendly. You'll find it helpful whether you're a student learning about seismology or a researcher needing some quick visualizations.
Download the Software
You can grab the Magnitude-Frequency Distribution Plotter here! It’s simple to set up and will have you plotting in no time!
User Reviews for Magnitude-Frequency Distribution Plotter FOR MAC 1
-
for Magnitude-Frequency Distribution Plotter FOR MAC
Magnitude-Frequency Distribution Plotter is a versatile tool for earthquake researchers. Easy to use on multiple platforms.