
Description
Magnitude-Frequency Distribution Plotter
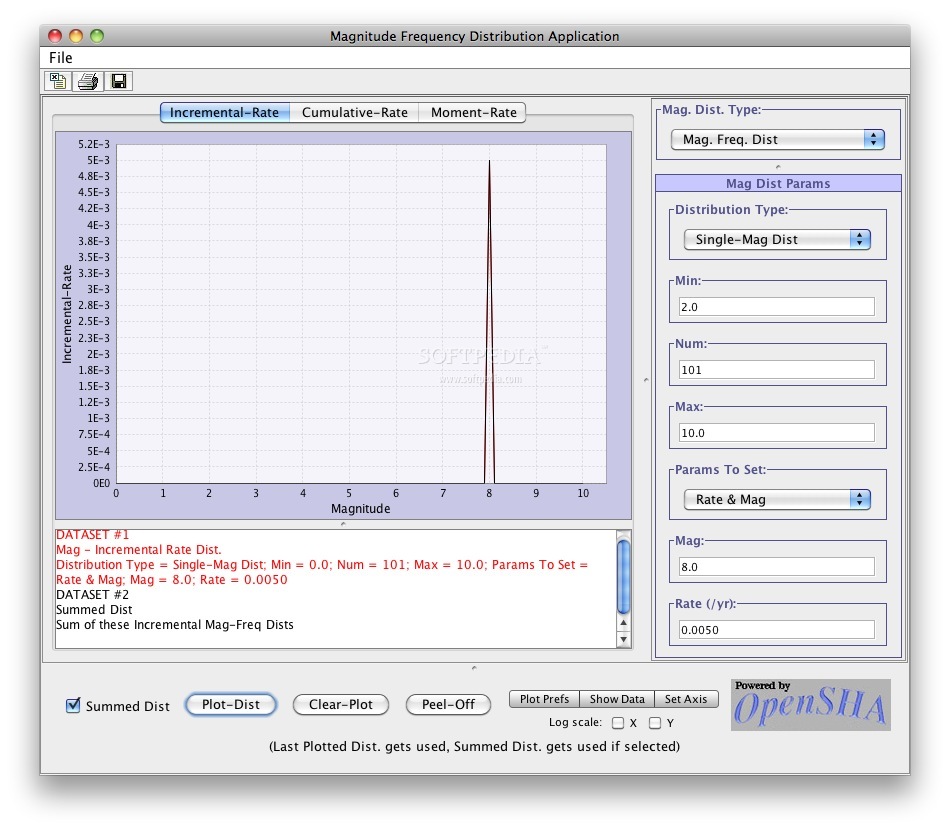
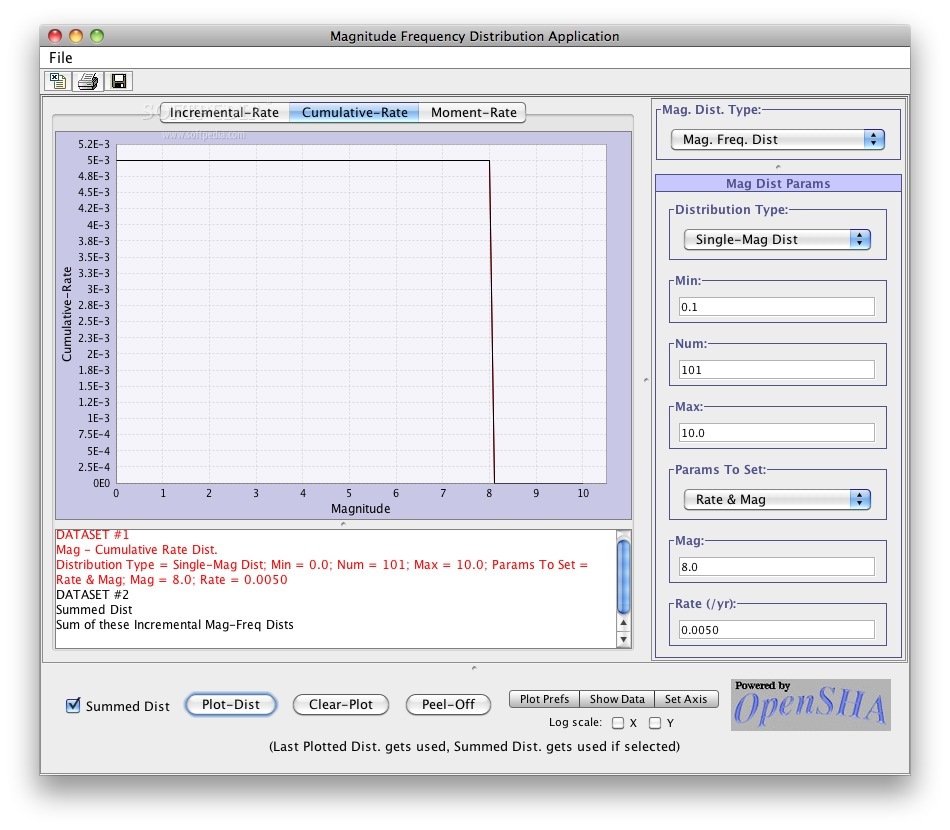
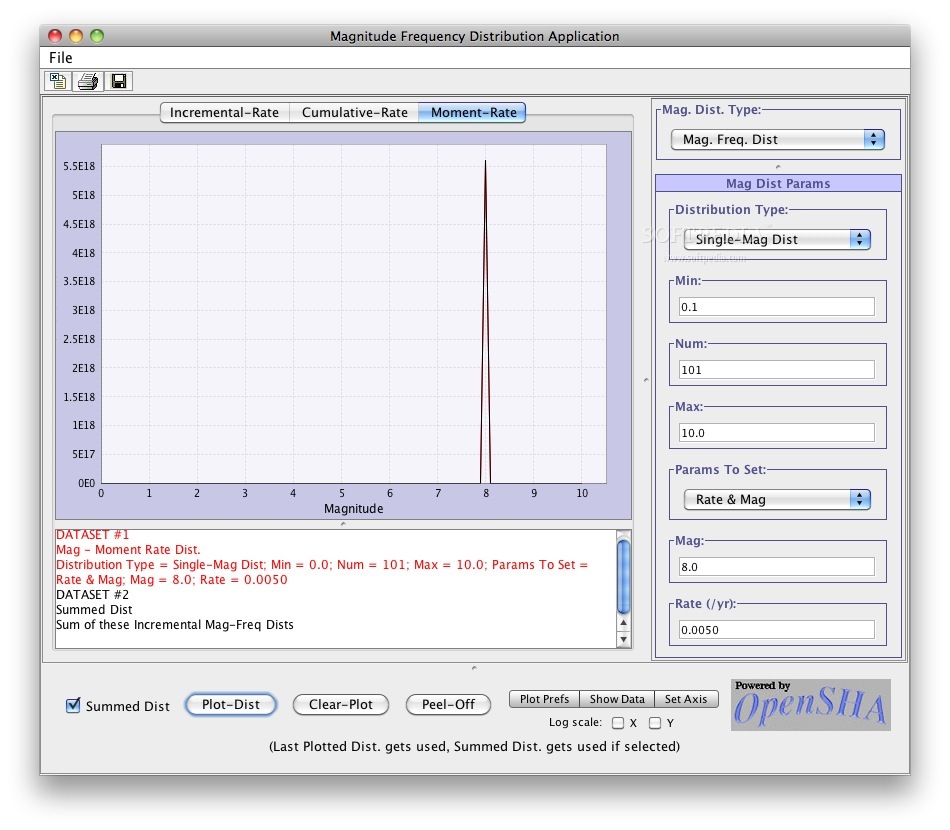
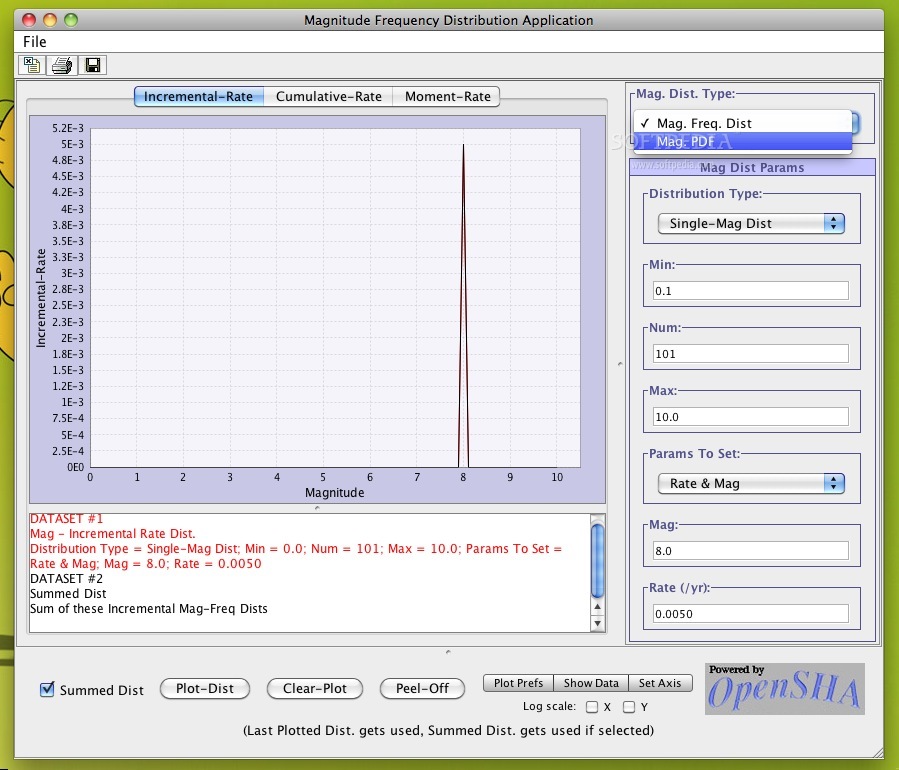
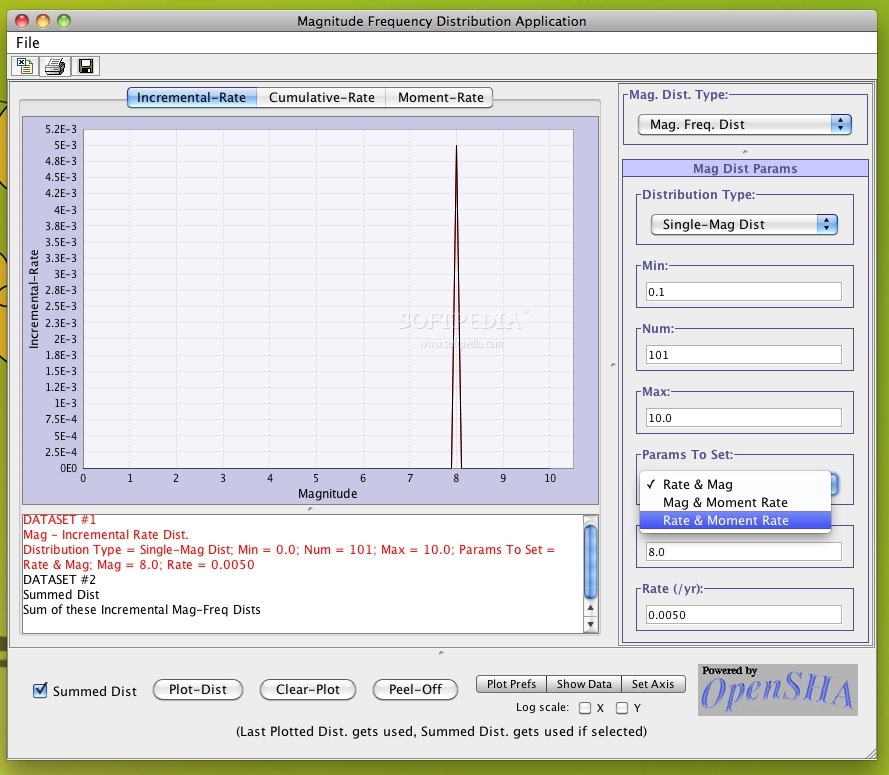
Magnitude-Frequency Distribution Plotter is a free tool that helps you create graphs showing how often earthquakes of different magnitudes happen. It’s pretty neat, right? You can use it to visualize magnitude-frequency distributions of earthquake magnitude PDFs easily.
What Can You Do with This Software?
This software makes it super simple to plot data without needing to be a coding whiz. Whether you're a student or just curious about seismic activity, this app has your back!
Supported Platforms
The cool thing about Magnitude-Frequency Distribution Plotter is that it's written in Java. That means you can run it on Mac OS X, Windows, and Linux. So, no matter what computer you’re using, you’re covered!
Easy to Use Interface
The interface is user-friendly and straightforward. You'll find everything laid out nicely so that even if you’re not tech-savvy, you’ll still figure it out quickly. Just input your data and watch the magic happen!
Get Started Today!
If you're excited about visualizing earthquake data, why not give it a try? You can download the Magnitude-Frequency Distribution Plotter here!
User Reviews for Magnitude-Frequency Distribution Plotter FOR MAC 1
-
for Magnitude-Frequency Distribution Plotter FOR MAC
Magnitude-Frequency Distribution Plotter is user-friendly for plotting earthquake magnitude PDFs. Easy to use on Mac, Windows, and Linux.