
Description
JMathPlot
JMathPlot is a Java plot library that empowers you to effortlessly create various types of graphs in both 2D and 3D. From scatter plots to line plots, this versatile library has got you covered.
Key Features:
- Create 2D/3D scatter plots with ease
- Generate visually appealing 2D/3D line plots
- Design intricate 2D staircase plots
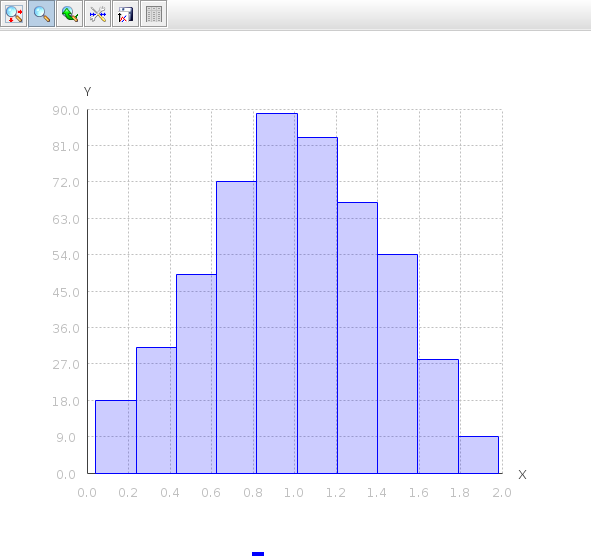
- Visualize data using 2D/3D histogram plots
- Utilize 2D/3D boxplots for detailed analysis
- Construct 3D grid plots for a comprehensive view
- Plot 2D/3D quantiles for statistical representation
Technical Specifications:
- Price: FREE
- Publisher: Yann Richet
Don't miss out on the opportunity to enhance your data visualization capabilities with JMathPlot. Download it now and take your graphs to the next level!
User Reviews for JMathPlot 7
-
for JMathPlot
JMathPlot is a versatile Java library for creating various types of plots such as scatter, line, histogram, and box plots.
-
for JMathPlot
JMathPlot is an amazing tool! The variety of plotting options makes it perfect for my data visualization needs.
-
for JMathPlot
I love JMathPlot! It's intuitive and powerful, allowing me to create stunning 2D and 3D graphs effortlessly.
-
for JMathPlot
This app has exceeded my expectations. The user interface is sleek, and the plots are high quality. Highly recommend!
-
for JMathPlot
Absolutely fantastic! JMathPlot offers diverse plotting features that are essential for any data analyst. Five stars!
-
for JMathPlot
JMathPlot is a game changer for visualizing data. The ease of creating different types of plots is invaluable!
-
for JMathPlot
I am thoroughly impressed with JMathPlot! It simplifies complex data visualization tasks with great flexibility.