
Description
Google Interact Time Series Chart Maker
Google Interact Time Series Chart Maker is a super handy tool for anyone who needs to visualize time series data right in their Google Docs Spreadsheet. It’s like having a personal assistant that helps you make sense of your data!
Easy to Use Interface
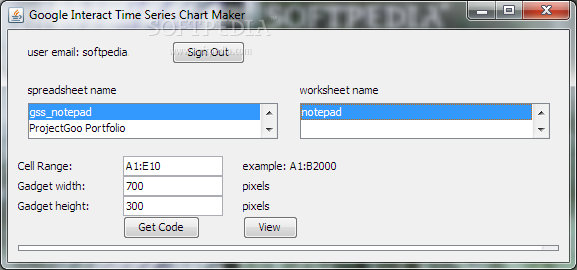
The best part? You don’t need to be a tech wizard to use it! Just fire up the program, sign in, and you’ll see all your spreadsheet documents pop up from your Google Docs account. From there, it’s all about selecting the data you want and watching the magic happen.
Create Amazing Charts
This tool lets you plot various time series data interactively. You can take control of how your information looks, making it easier for everyone to understand what you’re trying to show. Whether it's for school projects or work presentations, this software has got your back!
Test Drive It Today!
If you're curious about what Google Interact Time Series Chart Maker can do, why not give it a test drive? It’s worth checking out to see how much easier presenting data can be with the right tools.
A Must-Have for Data Visualization
No more guessing or trying to explain with words alone! With this chart maker, you can visually present your information in a way that makes sense. Plus, who doesn’t love some eye-catching charts?
User Reviews for Google Interact Time Series Chart Maker 1
-
for Google Interact Time Series Chart Maker
Google Interact Time Series Chart Maker allows easy plotting of time series data in Google Docs. A must-have for quick visualizations!